
What is a Star Schema?
A Star Schema in Power BI is a data modeling approach that organizes your data into one central fact table containing transactional, measurable data such as sales, quantity, and revenue, while multiple dimension tables surround it with descriptive information like product, store, customer, and date.
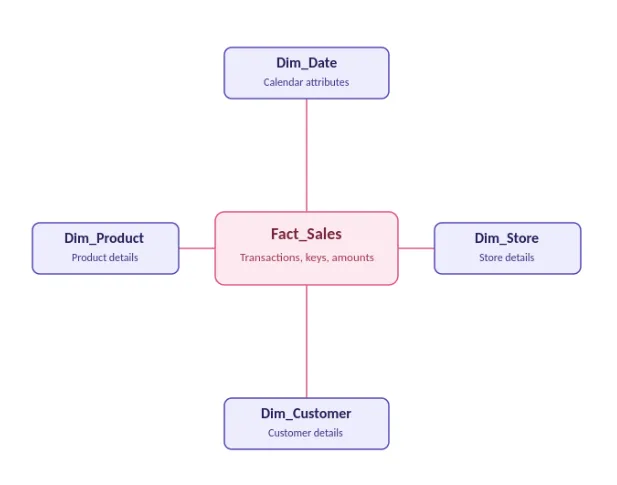
When you visualize this structure, the fact table sits at the center with dimension tables branching outward, creating a shape that resembles a star hence the name Star Schema.
Star Schema in Power BI is the data modeling approach recommended by Microsoft because it improves report performance, simplifies DAX calculations, and enables scalable, production-ready analytics. It serves as the foundation for building efficient and high-performing Power BI data models.
Facts vs. Dimensions: The Core Concept
Fact Tables
A fact table stores the numbers you want to measure or analyze sales amount, quantity sold, discount given, profit margin. Fact tables are usually long (millions of rows) but narrow (few columns) mostly numeric measures plus foreign keys linking out to dimensions.
Dimension Tables
A dimension table stores the descriptive "who / what / when / where" context that gives the numbers meaning product name, category, brand, store location, customer segment, date. Dimension tables are usually short (thousands of rows) but wide (many descriptive columns).;
- If it's a number you calculate or aggregate → it's a FACT
- If it's a label you filter or group by → it's a DIMENSION
A Real Retail Example: D-Mart Sales Data
Let's ground this in something practical a D-Mart-style retail chain selling groceries and household items across multiple store locations. Here's how the star schema would look.
Fact Table: Fact Sales
| SalesID | DateKey | ProductKey | StoreKey | CustomerKey | Qty | Unit Price | Discount | Sales Amount |
| 1001 | 20260701 | P045 | S012 | C3301 | 3 | 45.00 | 5.00 | 130.00 |
| 1002 | 20260701 | P118 | S007 | C9982 | 1 | 220.00 | 0.00 | 220.00 |
Dimension Table : Dim Product
| ProductKey | ProductName | Category | SubCategory | Brand |
| P045 | Toor Dal 1kg | Grocery | Pulses | DMart Premia |
| P118 | Steel Cookware Set | Home | Kitchenware | Nova |
Dimension Table: Dim Store
| StoreKey | StoreName | City | Region | StoreType |
| S012 | DMart Vadodara | Vadodara | West | Hypermarket |
| S007 | DMart Andheri | Mumbai | West | Supermarket |
Dimension Table : Dim Date
| DateKey | Date | Month | Quarter | Year | Day of Week |
| 20260701 | 01-Jul-2026 | July | Q3 | 2026 | Wednesday |
Dimension Table: Dim Customer
| CustomerKey | CustomerName | Segment | LoyaltyTier |
| C3301 | Registered Member | Regular | Silver |
| C9982 | Registered Member | Regular | Gold |
The Star Schema View
Here's what that relationship actually looks like once it's modeled: one fact table in the center, with each dimension table branching outward and connecting back through a single key. This is exactly how it should appear in Power BI View.
Why "One Big Flat Table" Works in a Demo... But Breaks at Scale
A lot of beginners skip star schema entirely. They pull one giant Excel-style export where every row repeats the product name, store name, city, and date alongside the sale and it works fine when you're testing with 500 rows. Here's what happens when D-Mart's real transaction volume kicks in:
Massive Data Duplication
"D-Mart Vadodara," "West," and "Hypermarket" get repeated on every single row of every transaction from that store. Multiply that across millions of daily transactions from hundreds of stores, and your file size balloons directly increasing .pbix file size and refresh time.
Slower Refresh and Query Performance
Power BI's Vert iPAQ engine compresses data far more efficiently when repetitive text values live in small dimension tables rather than being repeated across a massive fact table. A star schema can compress dramatically better than an equivalent flat table, meaning faster report load and faster DAX calculations.
Inconsistent Filtering and Broken Relationships
In a flat table, if "Vadodara" is spelled two different ways across different data loads, your filters silently break. A dimension table gives you one source of truth for each entity.
Harder DAX and Time Intelligence
Functions like TOTALYTD, SAMEPERIODLASTYEAR, and DATEADD expect a proper Dim_Date table marked as a date table. Flat tables make this unreliable or impossible.
Difficult to Scale New Data Sources
If D-Mart later wants to add e-commerce sales alongside in-store sales, a star schema lets you simply add a new fact table (Fact_OnlineSales) that reuses the same Dim_Product, Dim_Store, and Dim_Date tables. A flat table forces you to rebuild everything from scratch.
Star Schema vs. Flat Table: Quick Comparison
| Aspect | Flat Table | Star Schema |
| File size at scale | Large, redundant | Compact, compressed |
| Refresh speed | Slows down significantly | Stays fast |
| DAX complexity | Error-prone | Clean, predictable |
| Time intelligence | Often broken | Works natively |
| Scalability | Poor | Excellent |
| Best for | Quick demos, tiny datasets | Production reports, real business data |
Key Takeaways
Remember This
- A star schema separates measurable numbers (facts) from descriptive context (dimensions).
- In the D-Mart example, Fact_Sales holds transaction-level numbers, while Dim_Product, Dim_Store, Dim_Date, and Dim_Customer hold the descriptive context.
- Flat tables feel easier at first, but they duplicate data, slow down refreshes, and break DAX time intelligence as data volume grows.
- Star schema is the foundation of every scalable, production-ready Power BI data model.