Introduction
Every Power BI report begins the same way: with a connection to data. Before a single chart or KPI appears on a canvas, Power BI needs to know where the underlying data lives and how to reach it. This guide walks through that very first step connecting your first Data Source in Power BI and gives you the context needed to make confident choices as your reports grow more advanced.
Power BI uses Power Query as its connection engine, and every data source article in Microsoft's documentation describes what a given connector can do, including whether it supports Direct Query mode.
Understanding the Get Data Experience
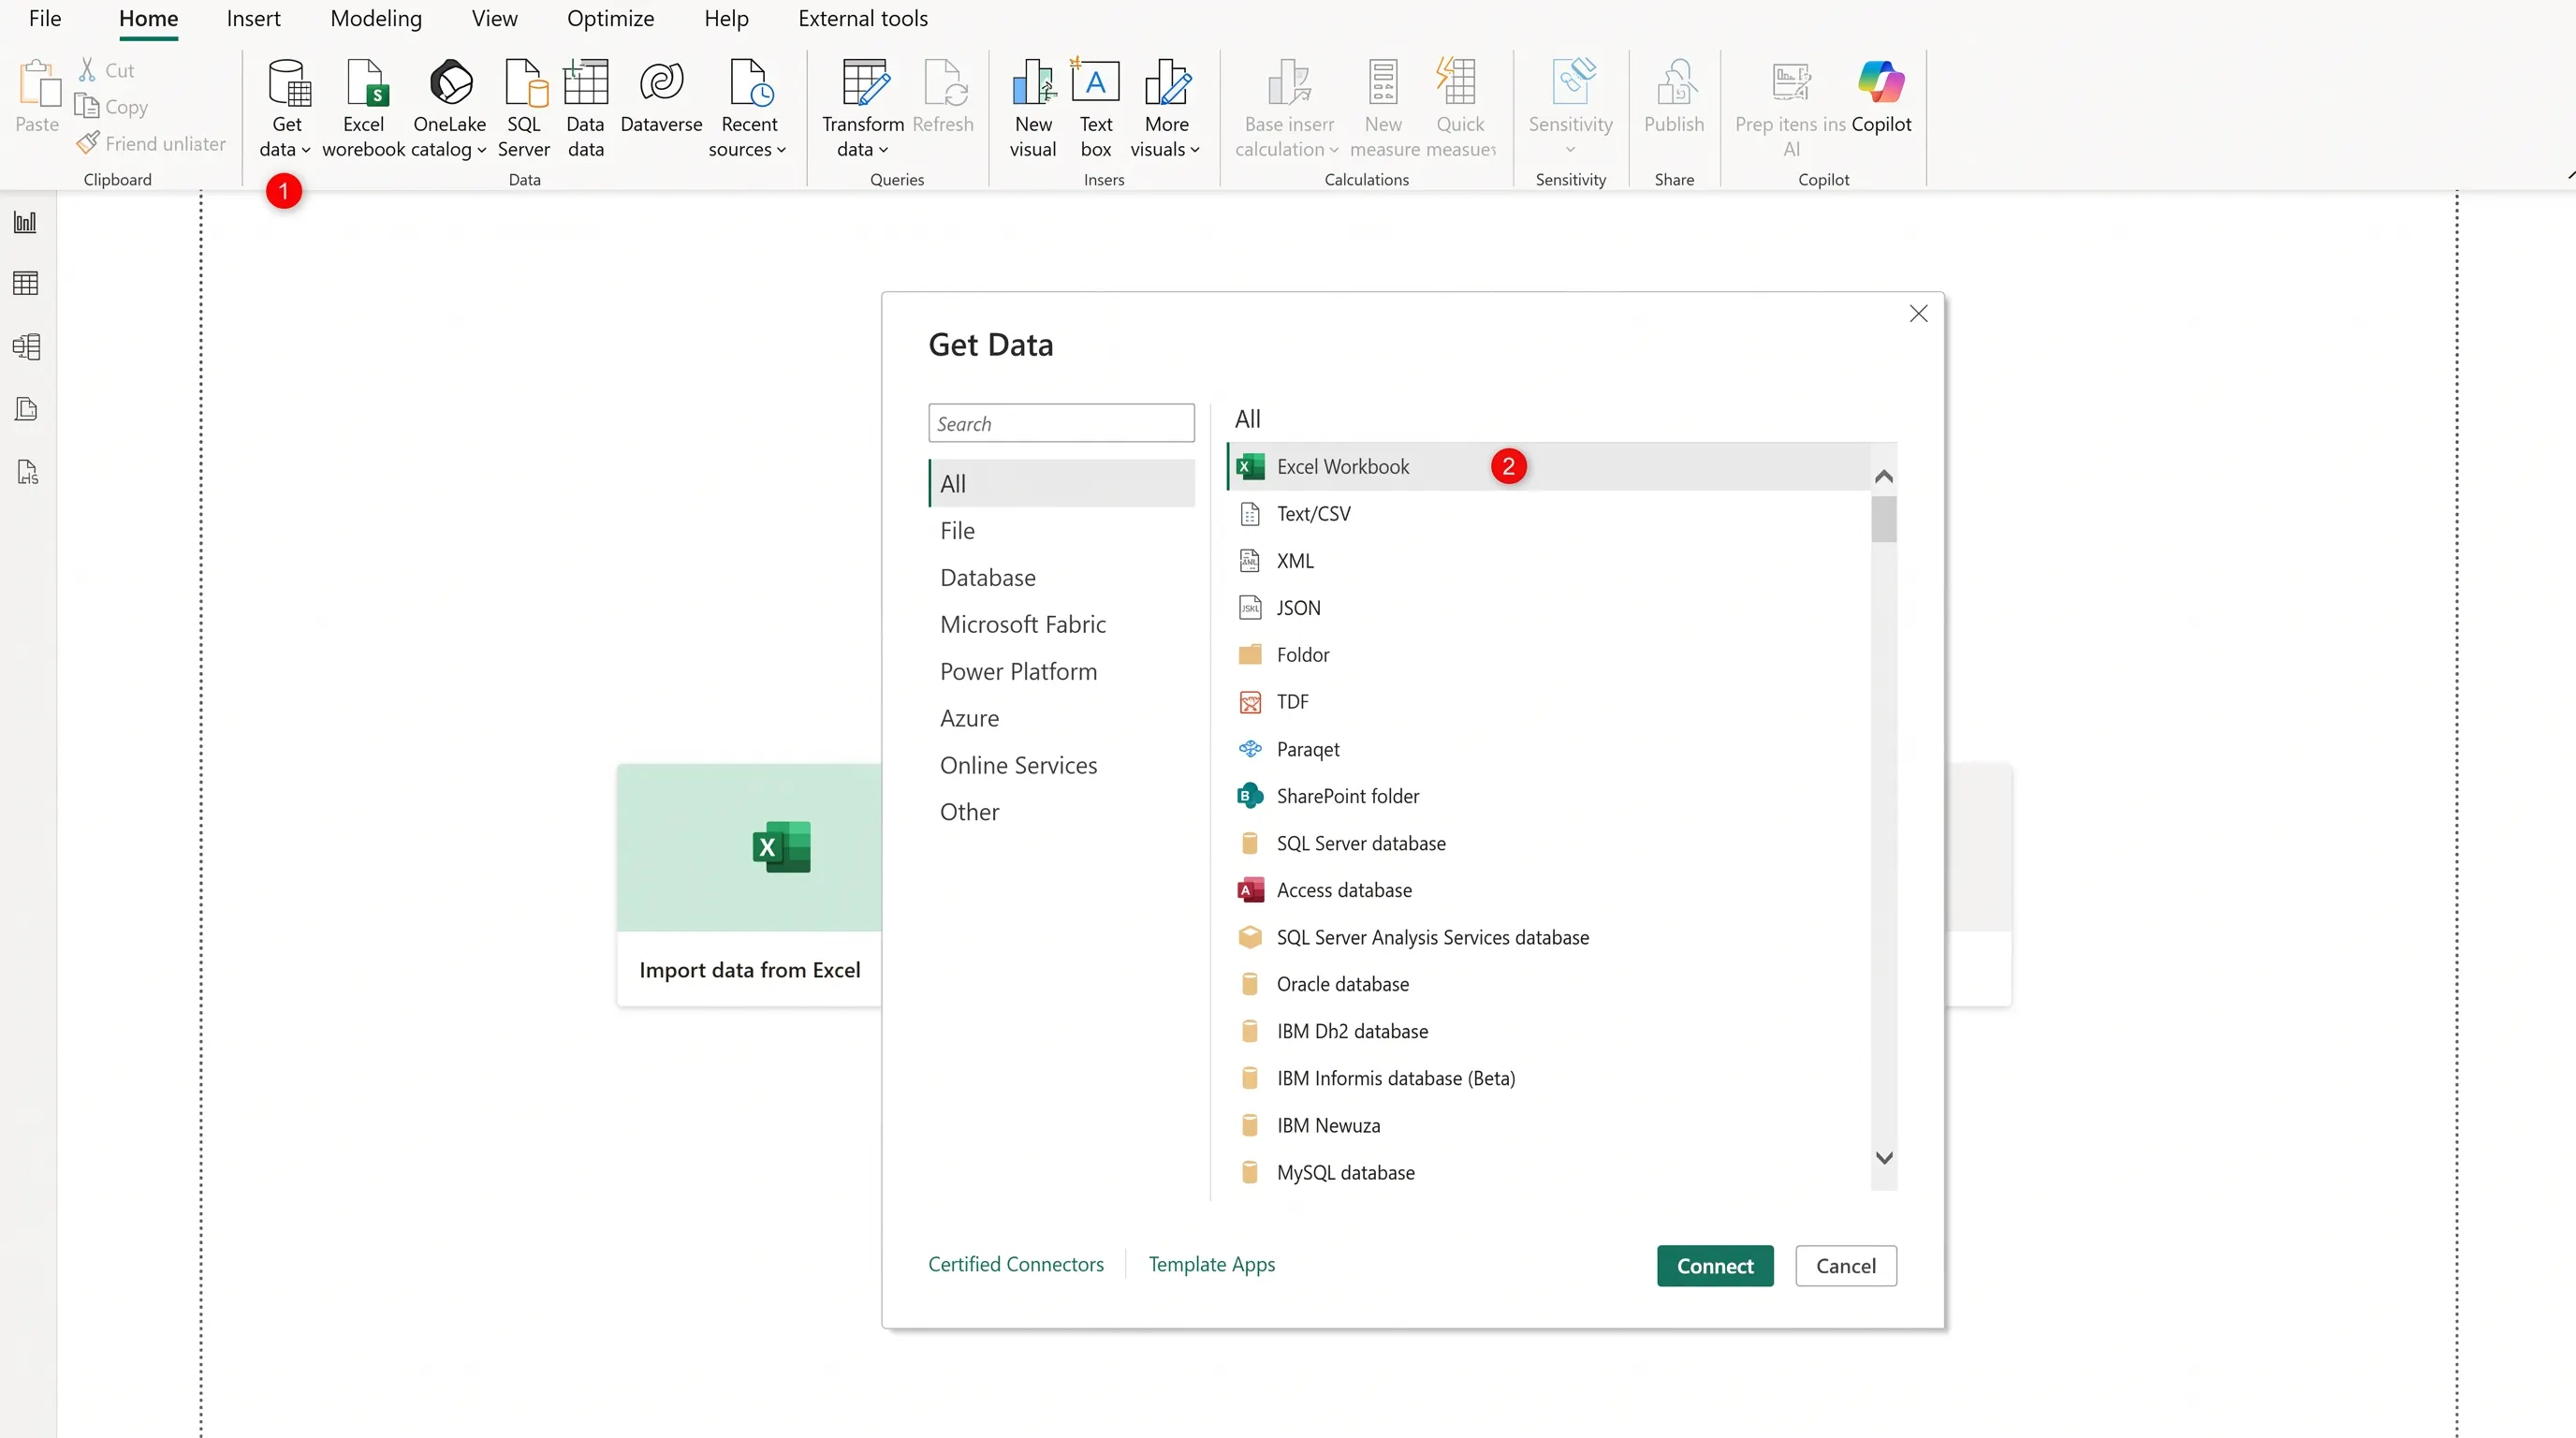
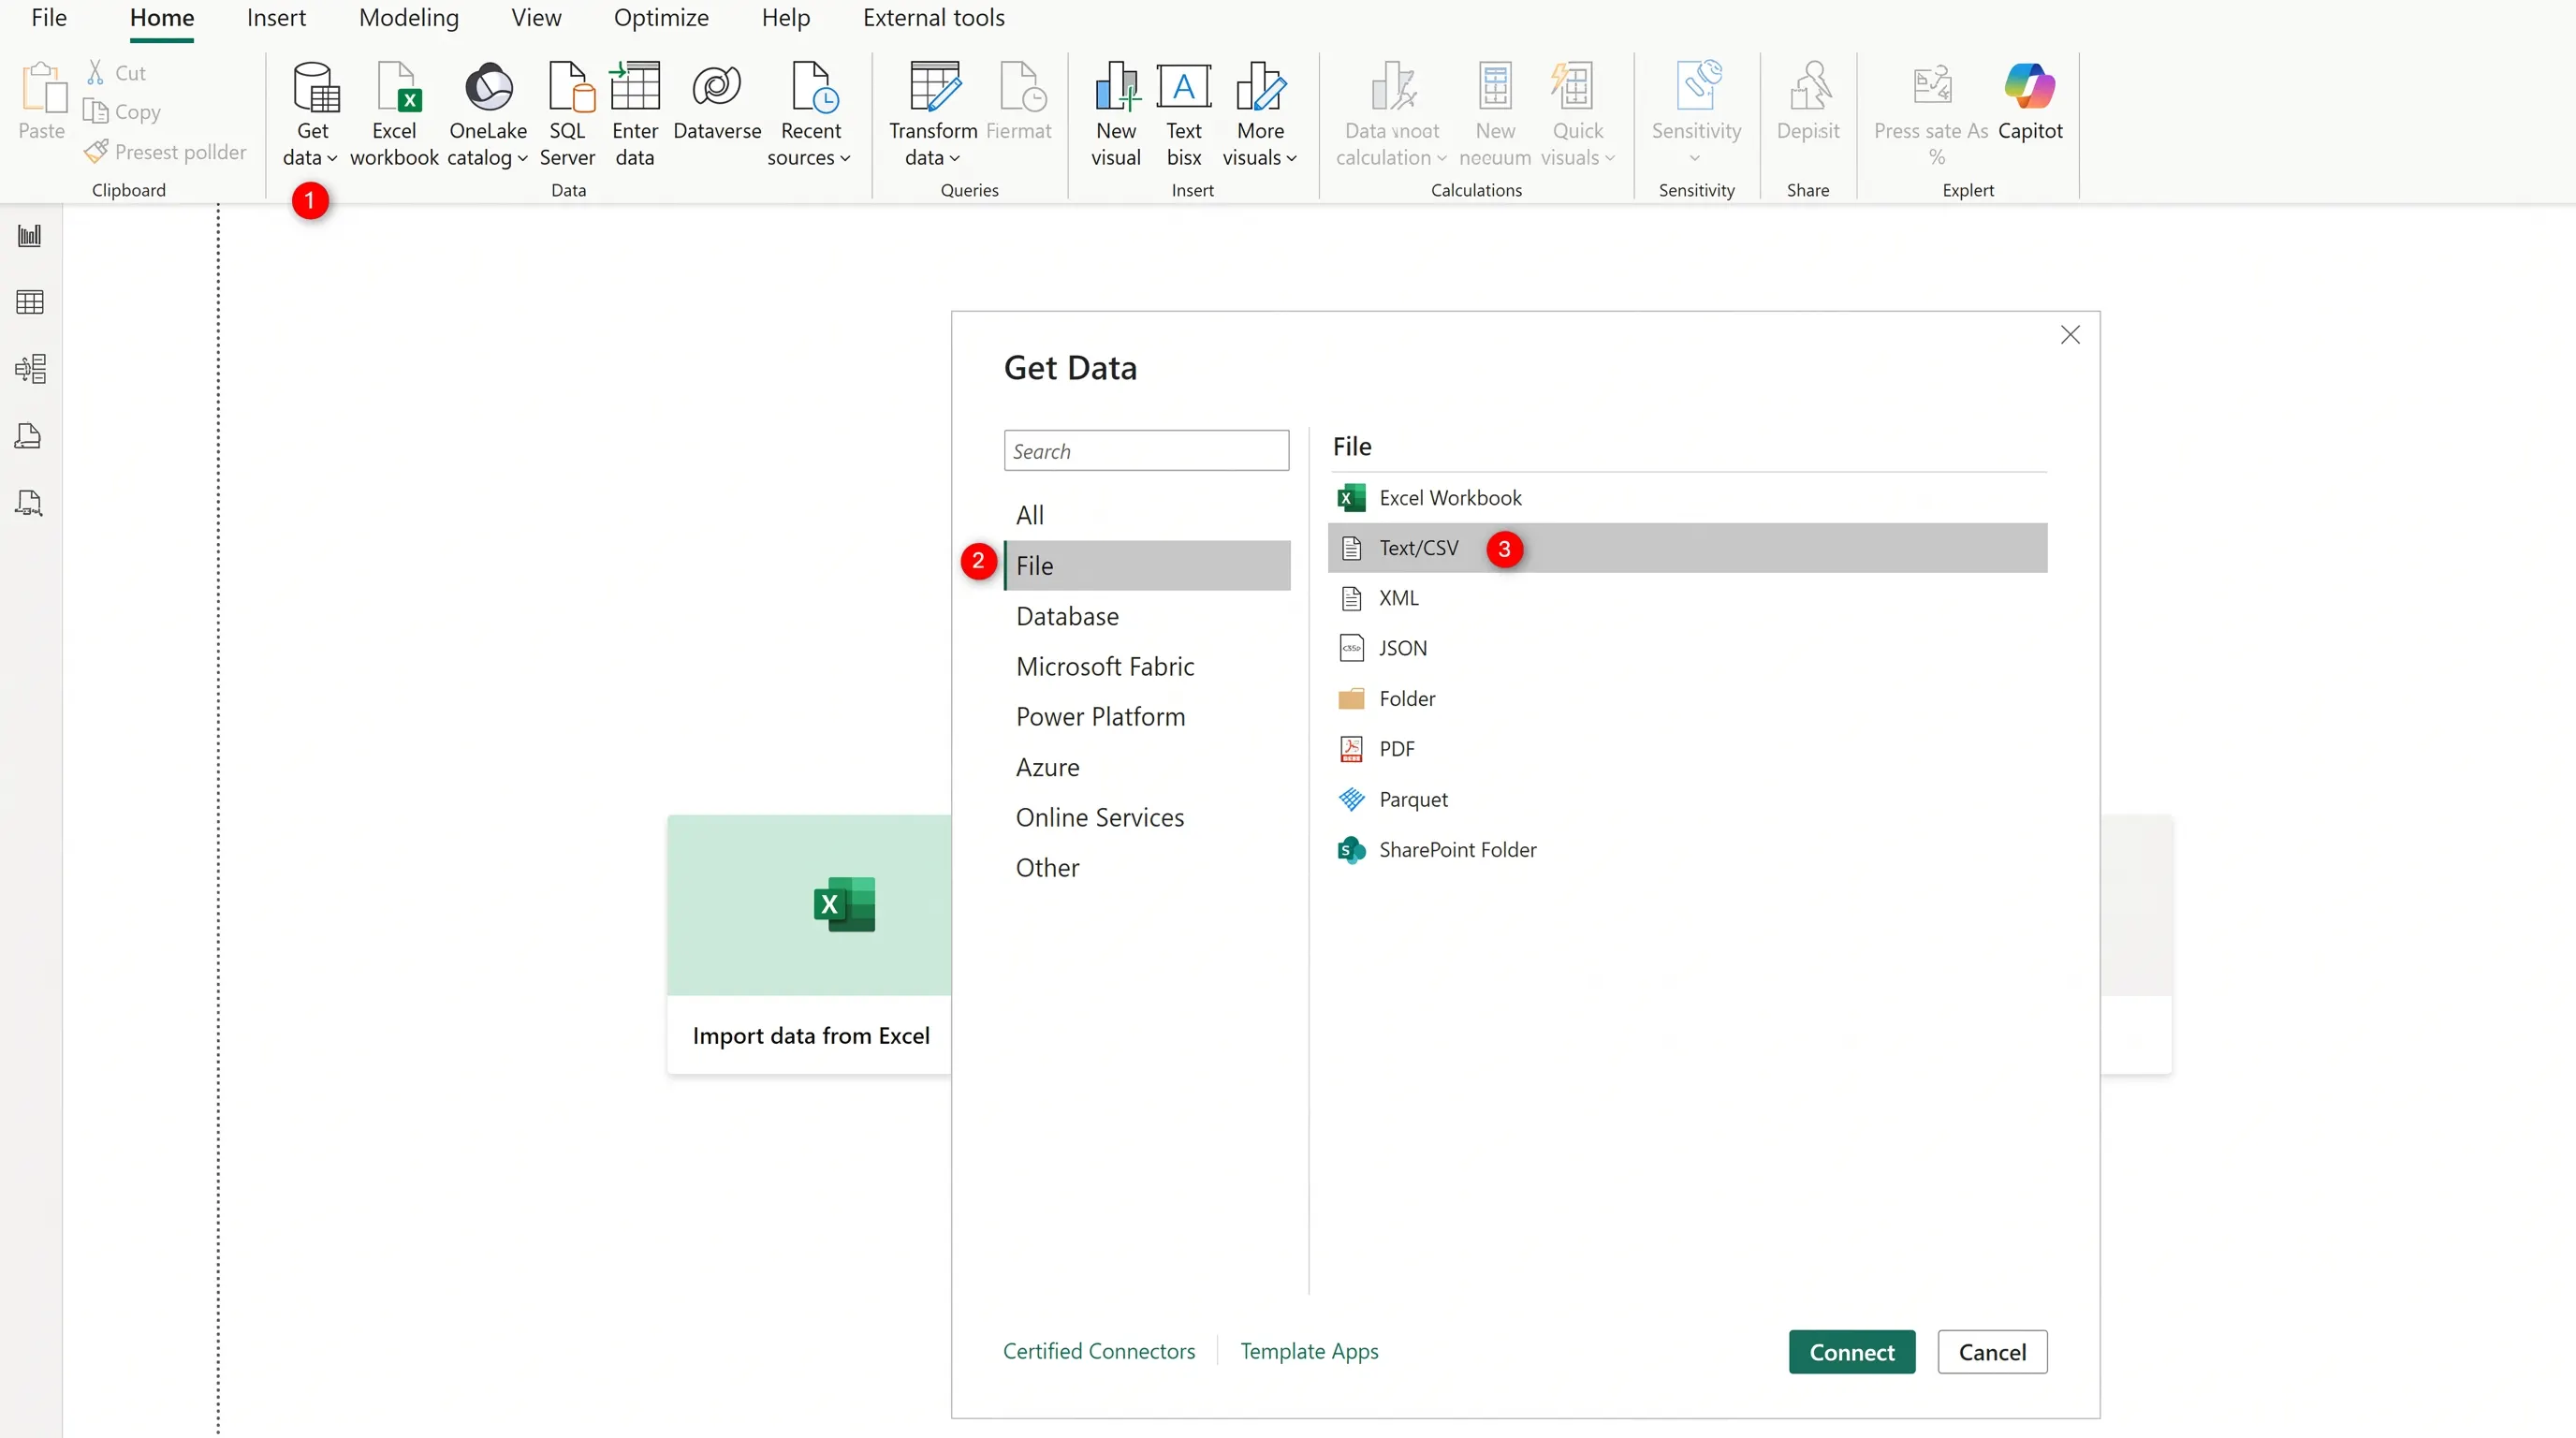
In Power BI Desktop, the connection journey starts on the Home ribbon. Selecting the Get data button label, or its down arrow, opens the Common data sources list. If the source you need isn't listed there, selecting More opens the full Get Data dialog box.
The Get Data dialog organizes every available connector into clear categories, so you are never guessing where a source belongs:
File — Excel workbooks, Text/CSV, XML, JSON, PDF, Parquet, and folders
Database — SQL Server, Azure SQL Database, Oracle, MySQL, PostgreSQL, and more
Microsoft Fabric — OneLake and Fabric data warehouses
Power Platform — Power BI datasets, Dataverse, and Power Automate dataflows
Azure — Azure-hosted cloud data services
Online Services — Salesforce, Dynamics, Google Analytics, and similar SaaS platforms
Other — Web pages, blank tables, and blank queries for custom M scripts
Power BI also keeps a Recent section so you can quickly reconnect to sources you have used before, along with a OneLake catalog section for discovering Fabric data items your organization already has available.
Step-by-Step: Your First Connection
The exact dialogue changes slightly by source type, but the overall flow stays consistent across almost every connector. Using a simple Excel workbook as an example:
Open Power BI Desktop and, on the Home ribbon, select Get data.
Choose your source type for example, Excel workbook from the Common data sources list, or select More for the full catalog.
Select Connect, then browse to and select the file or enter the required connection details (server name, URL, or credentials).
Power BI Desktop reads the source and opens the Navigator window, showing the tables, sheets, or entities available.
Choose the tables you need, then select Load to bring the data in directly, or Transform Data to clean and shape it first in Power Query Editor.
Once loading finishes, the Fields pane displays every table and column you selected, ready to be used in visuals and reports.
Import vs. DirectQuery: Choosing a Connectivity Mode
Many data sources let you choose how Power BI stores and refreshes the data once it's connected. This decision affects performance, refresh scheduling, and how much transformation flexibility you have.
Import Mode | DirectQuery Mode |
Data is copied into Power BI's own engine. | Data stays in the source system; Power BI queries it live. |
Full support for data transformation and modeling. | More limited transformation and modeling options. |
Semantic models in shared capacity are capped at 1 GB. | Well suited to large datasets that are impractical to import. |
Refresh must be scheduled, up to 8 times a day on shared capacity. | No scheduled refresh needed — every view queries fresh data. |
Import and DirectQuery cannot be mixed within a single report. | Every new field or slice triggers a query on the source database. |
There is no universally 'better' mode Import favors modeling flexibility and speed once loaded, while DirectQuery favors freshness and scale. Many teams start with Import while learning, then reach for DirectQuery as data volumes grow.
A Note on File-Based Sources
Flat files remain one of the most approachable ways to start. CSV files are simple text files with comma-separated rows and are easy to produce from tools like Excel, though data cannot be imported back into a .csv itself. For other flat formats such as XML or plain text, Excel's Get & Transform Data tools can query, transform, and load the data before it reaches Power BI. Excel workbooks themselves can hold worksheet data or content already modeled in Power Query, and Power BI can import from either.
Worked Examples: Four Common Connections
The steps below walk through four data sources beginners encounter most often. Each follows the same underlying pattern — Get data, provide connection details, review in Navigator, then Load or Transform.
Example 1 — Excel Workbook
On the Home ribbon, select Get data, then choose Excel workbook from the Common data sources list.
Browse to the file (for example, a sales tracking workbook) and select Open.
Power BI Desktop loads the workbook and opens the Navigator, listing every worksheet and named table it found.
Tick the worksheets or tables you need, then select Load to import them as-is, or Transform Data to clean columns first in Power Query Editor.
Example 2 — SQL Server Database
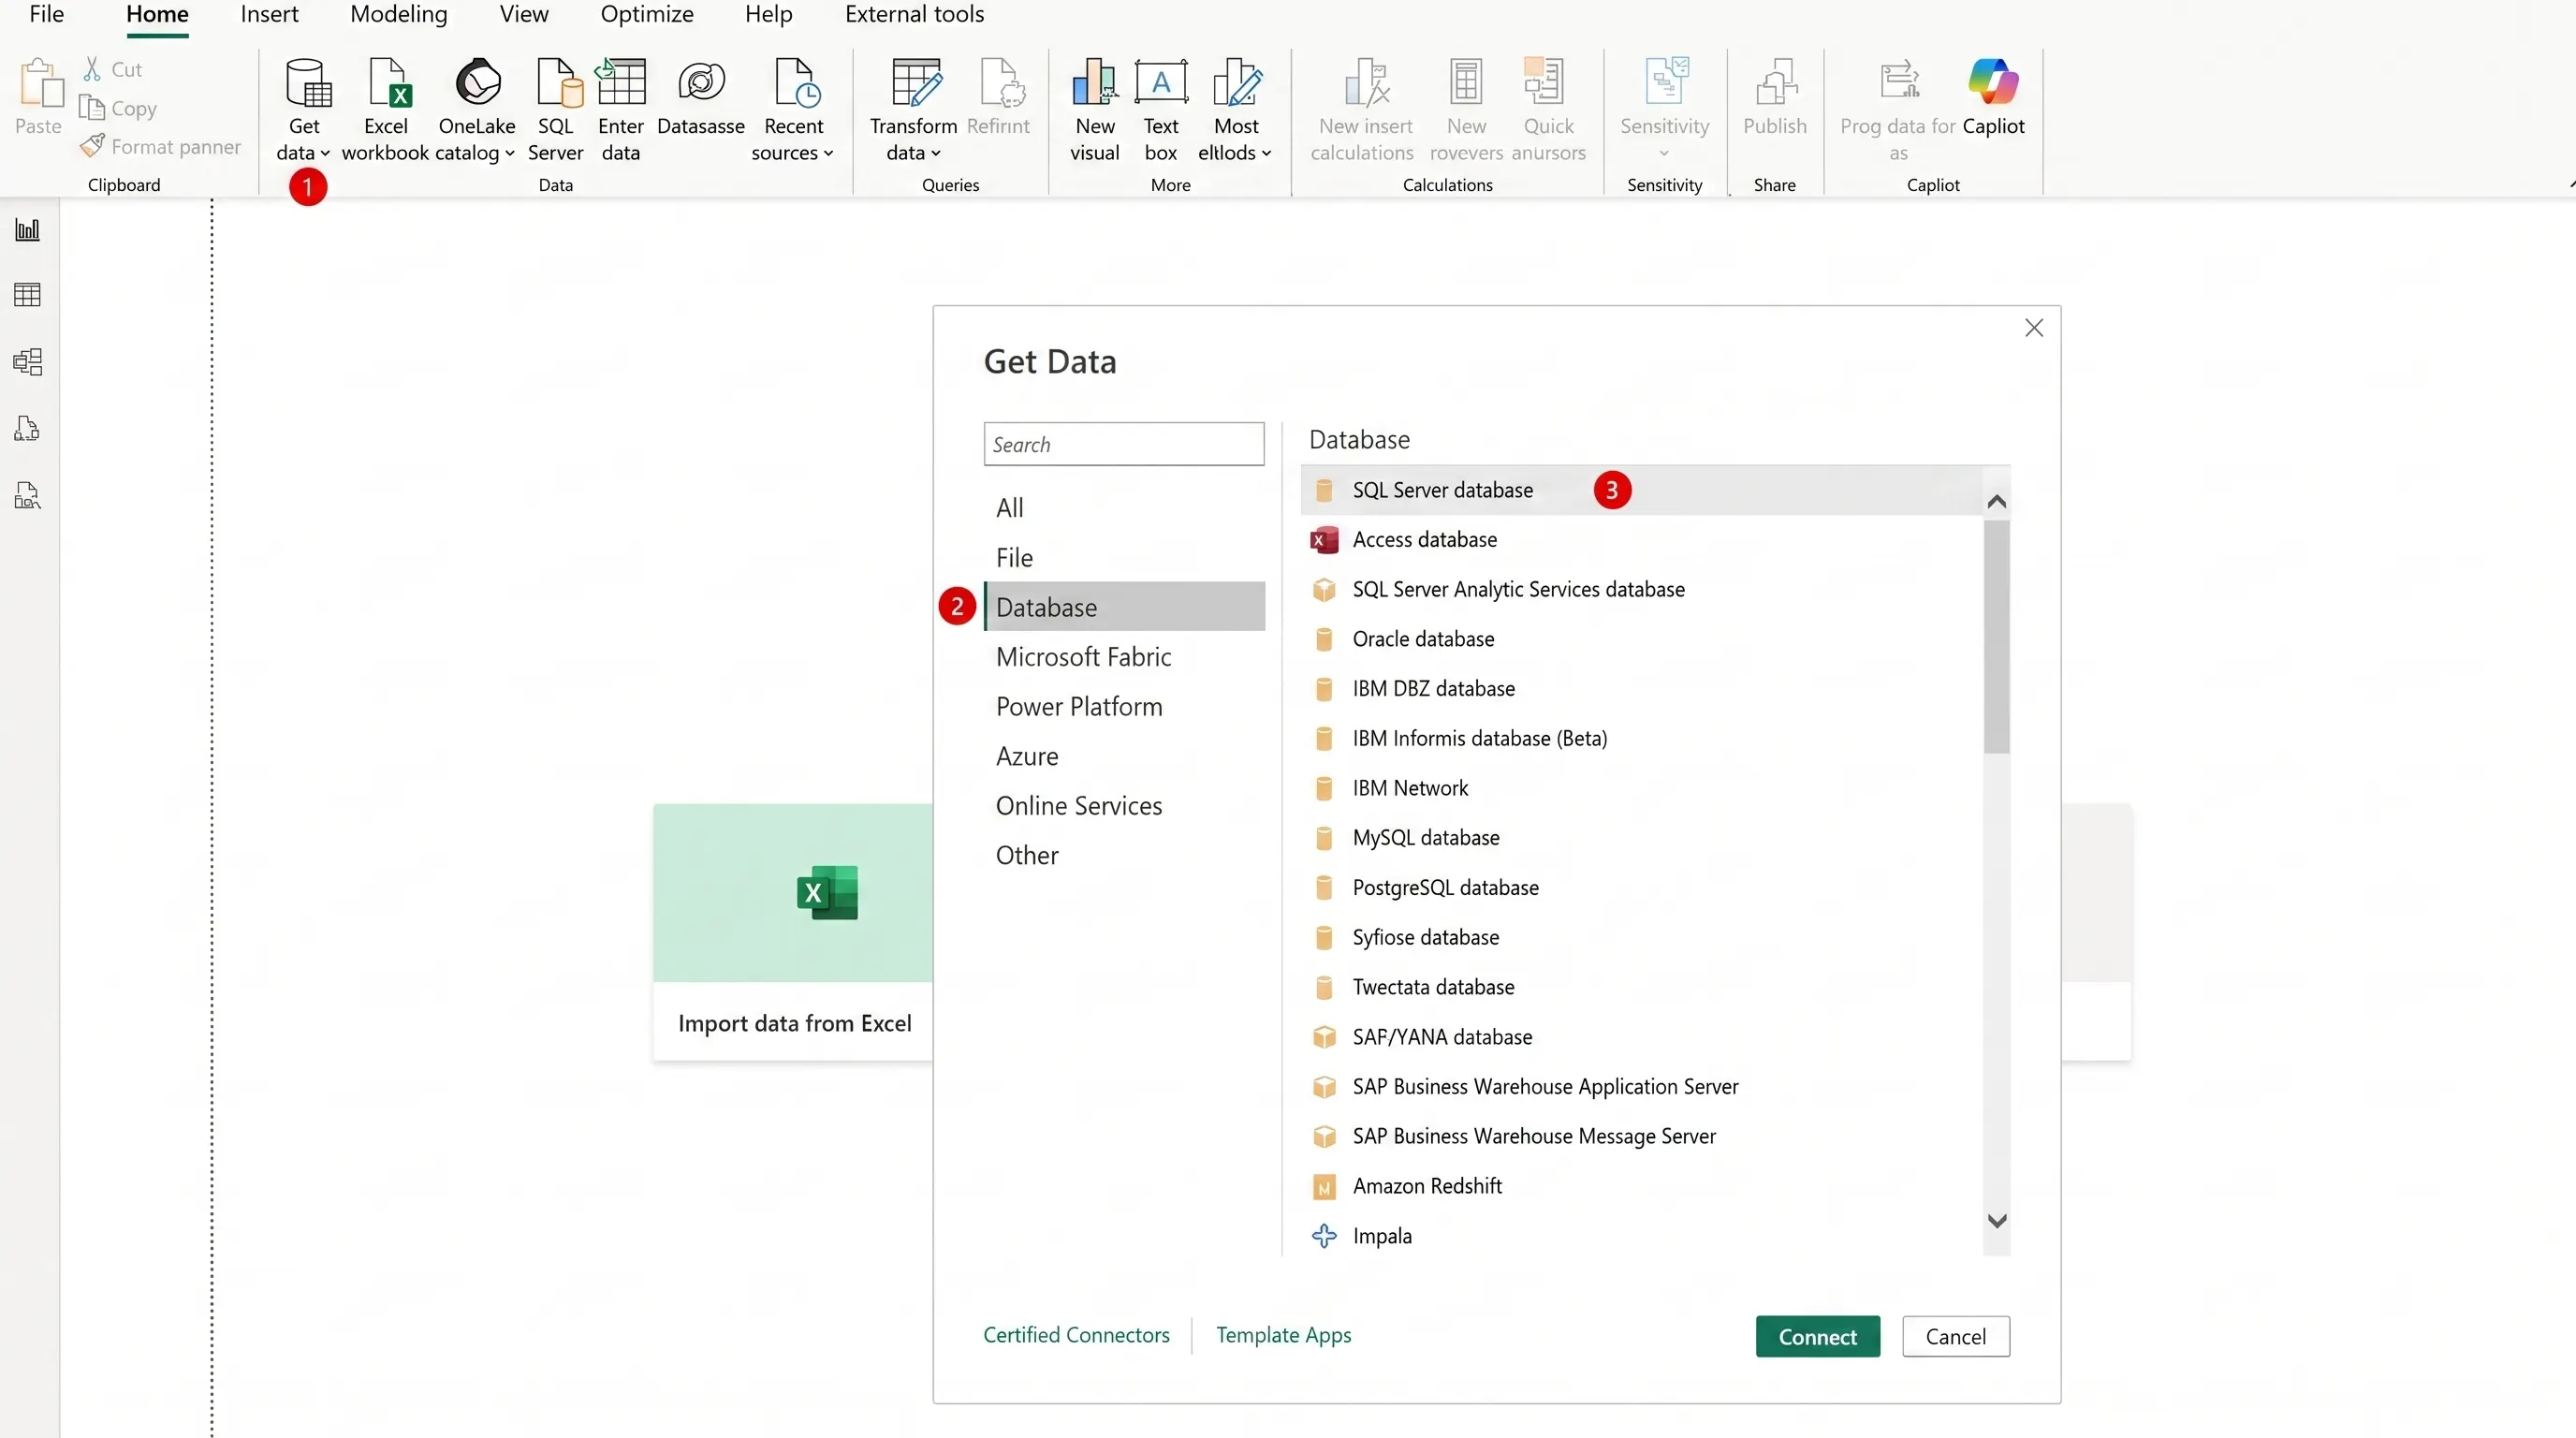
Select Get data > Database > SQL Server database, then select Connect.
In the SQL Server database dialog, enter the server name and, optionally, the database name.
Choose a Data Connectivity mode — Import to copy a snapshot into Power BI, or DirectQuery to query the server live.
Choose the authentication type required (Windows, Database, or Microsoft Entra ID) and enter credentials, then select Connect.
In Navigator, select the tables or views you need and choose Load or Transform Data.
Example 3 — Web (URL) Data Source
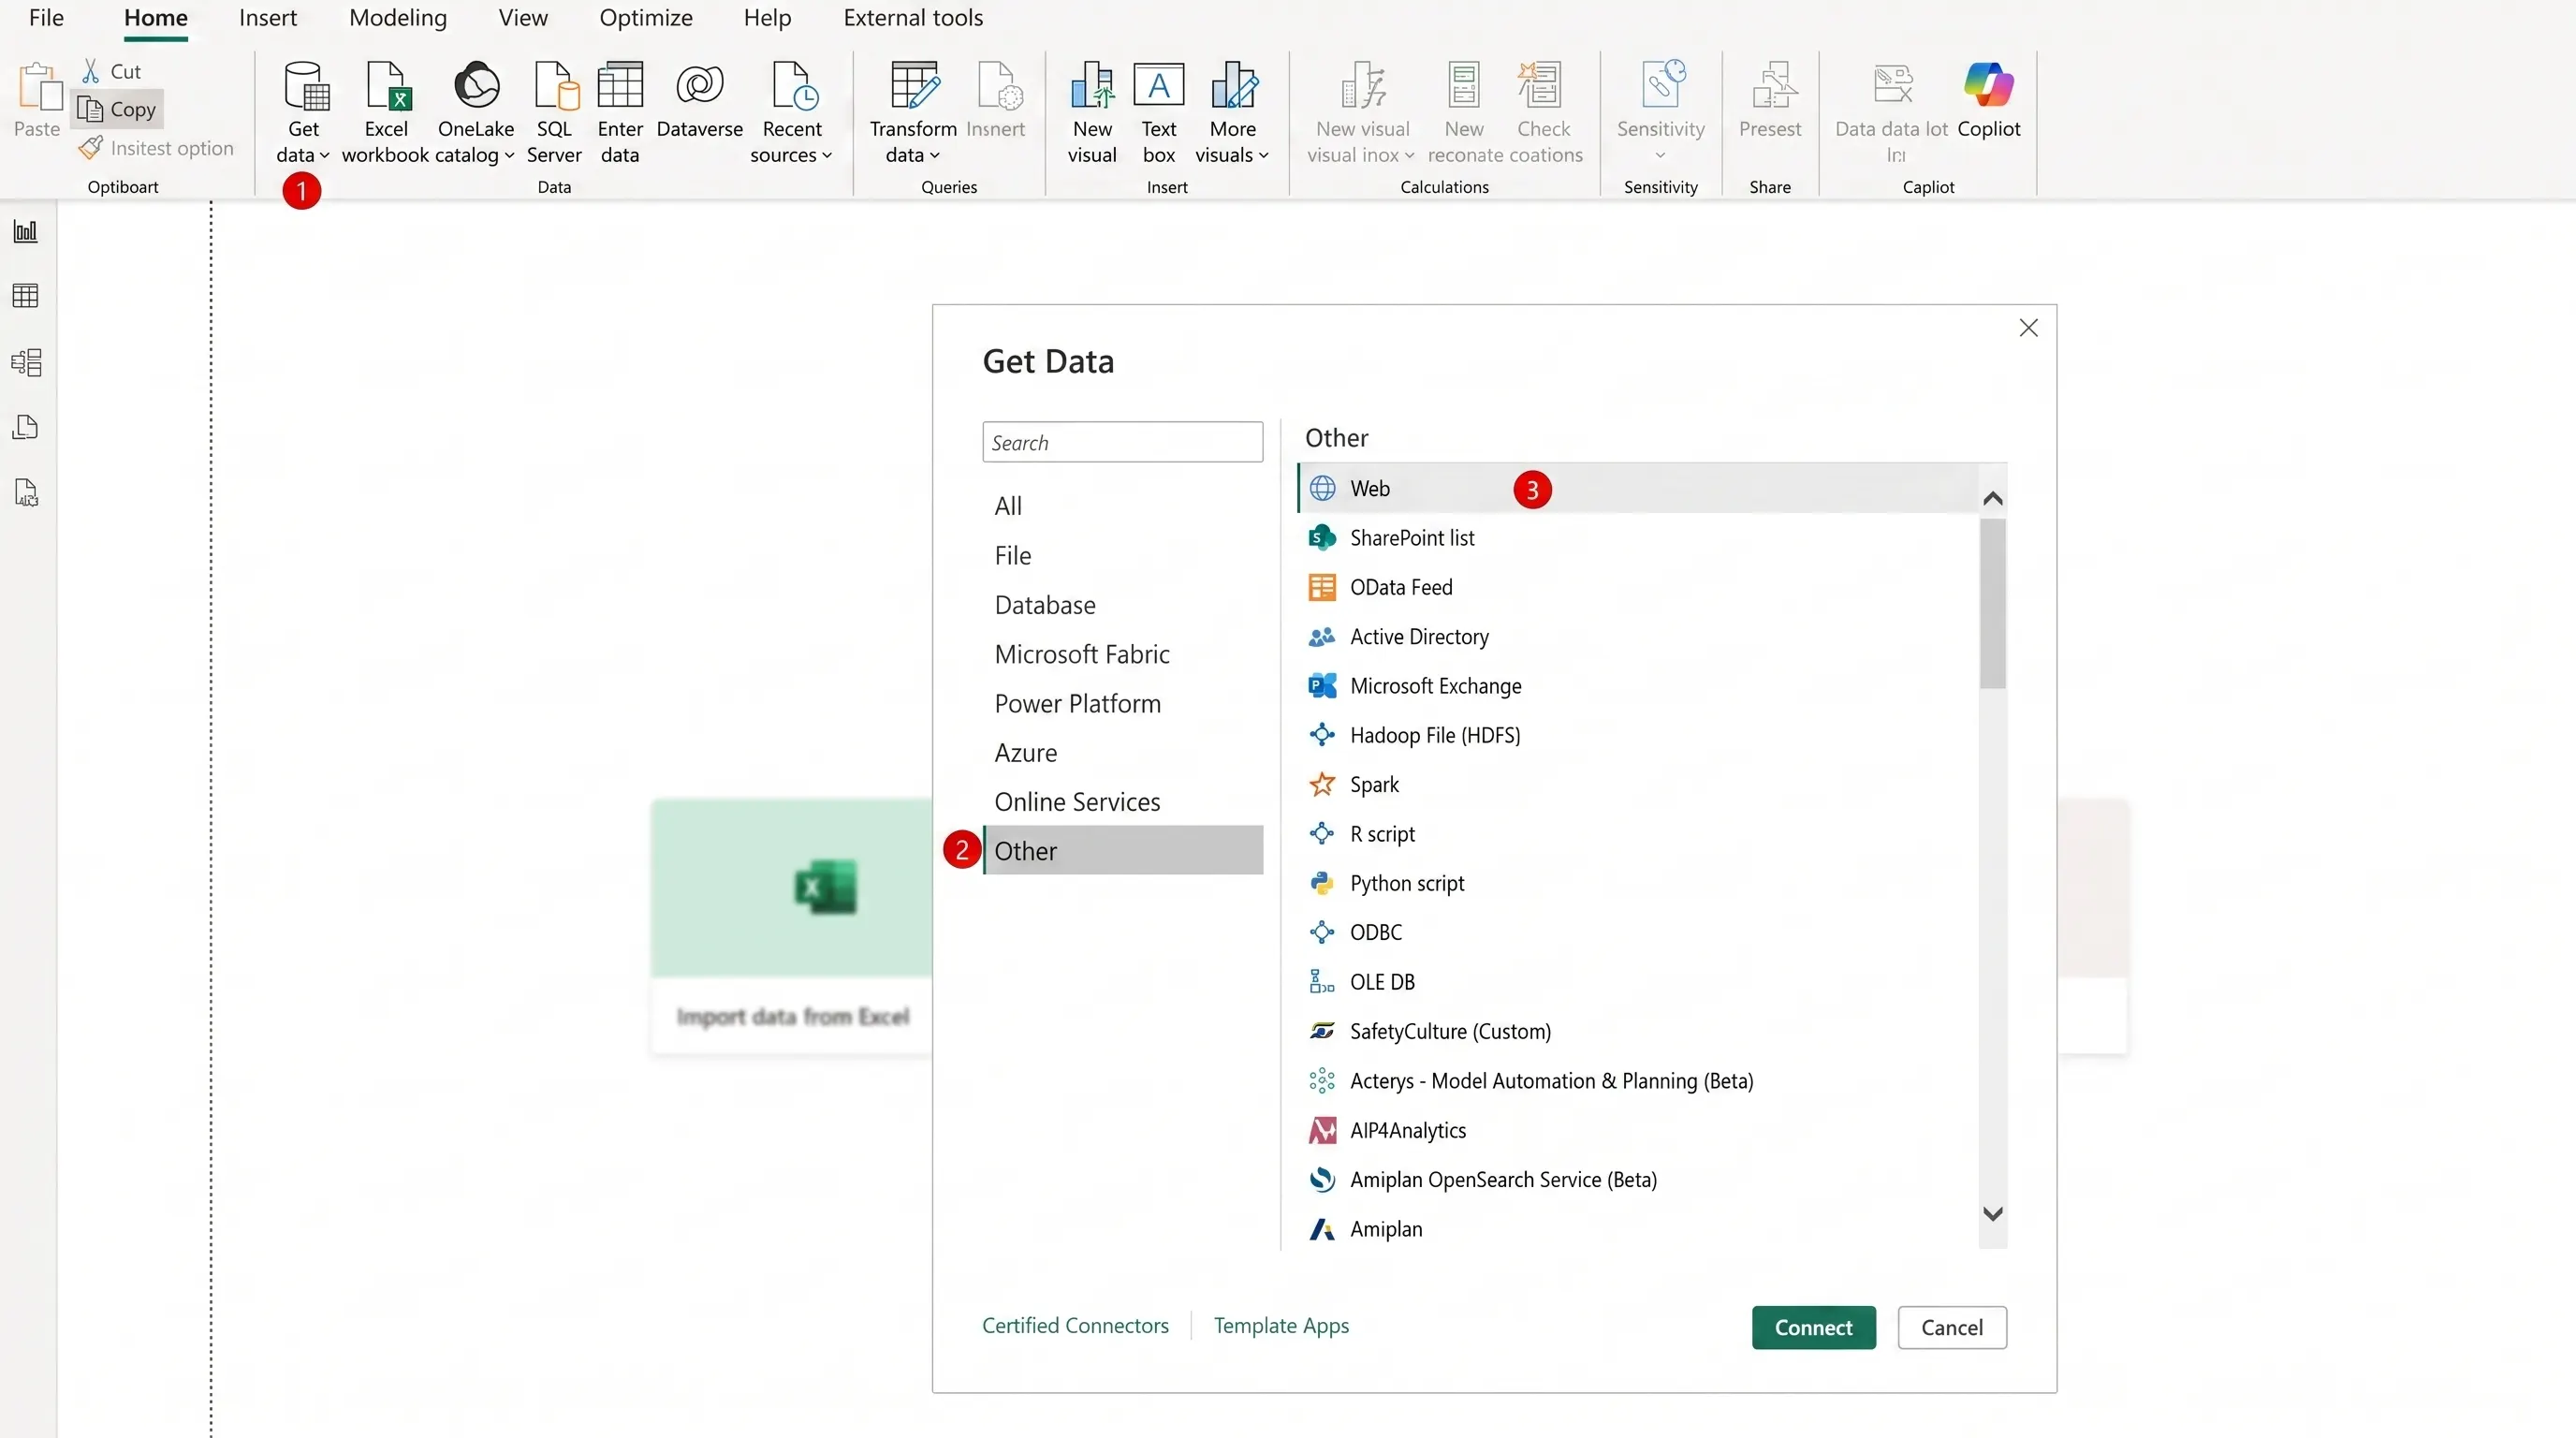
Select Get data > Other > Web, then select Connect.
In the From Web dialog, enter the full URL of the page or API endpoint that contains the data.
Select OK. If the page requires credentials, Power BI prompts for them before continuing.
Power BI Desktop reads the page and presents any detected tables in the Navigator.
Select the table you need and choose Load, or Transform Data to reshape it first.
Example 4 — CSV / Text File
Select Get data > File > Text/CSV, then select Connect.
Browse to the .csv or .txt file on your computer or network drive and select Open.
Power BI Desktop shows a preview of the file, including the detected delimiter, file origin, and data type for each column.
Adjust the delimiter or column types in the preview if anything looks incorrect.
Select Load to bring the data in directly, or Transform Data to clean it in Power Query Editor first.
Regardless of source type, the rhythm stays the same: Get data, supply connection details, preview in Navigator, then Load or Transform. Once this pattern feels natural, adding new data sources to any report becomes routine.
Conclusion
Connecting your first data source is a small step technically, but it sets the foundation for everything that follows your data model, your relationships, and ultimately the insights your organization will rely on. Take time to understand the category your source falls into, choose a connectivity mode deliberately rather than by default, and use the Navigator and Power Query Editor to shape data before it reaches your report canvas.
With this foundation in place, you're ready to move on to modeling relationships, writing your first measures, and building visuals that turn a raw connection into a genuine business insight.