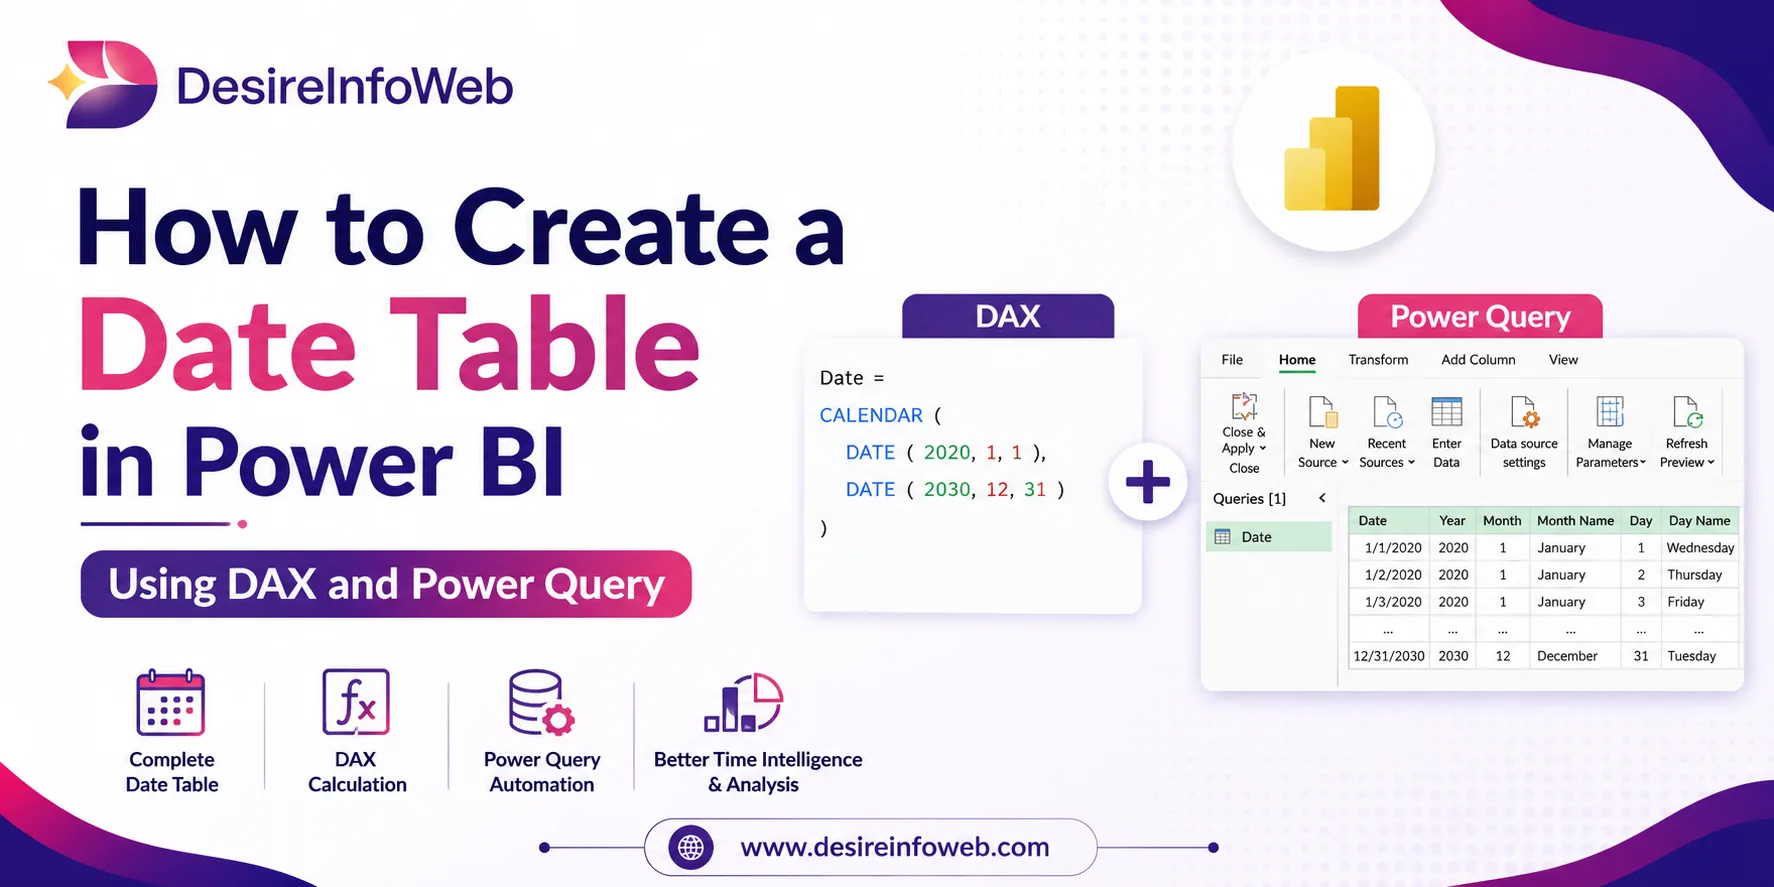
Why This Topic Matters
Almost every analytics model eventually needs to answer a question involving time sales this quarter versus last quarter, year-over-year growth, a rolling 90-day average, or simply “what happened in March.” Power BI and other DAX-based engines make these calculations possible through time intelligence functions, but those functions only work reliably when the model contains a properly built date table. Skipping this step, or relying on the automatic date hierarchies that tools generate behind the scenes, is one of the most common reasons reports produce incorrect totals, break during refresh, or slow down as the model grows.
This article consolidates the essential design principles for a Date Table in Power BI walks through both the DAX and Power Query approaches to building one, and explains exactly how to mark it as the model's official date table the step that unlocks full-time intelligence support.
A date table is a table that contains one row per date in a continuous range, along with descriptive columns such as Year, Month, Quarter, and Week. It acts as the central time dimension that every fact table in the model connects to.
Why Every Serious Model Needs One
Power BI's built-in Auto Date/Time feature can feel like it solves the problem automatically it silently creates a hidden date hierarchy for every date column in the model. In practice, this convenience becomes a liability as soon as a model grows beyond a single table.
- Every date column gets its own hidden table, multiplying storage and slowing down refresh and calculation time.
- There is no single, shared calendar, so different visuals can silently use inconsistent date logic.
- Fiscal calendars, custom week definitions, and holiday flags cannot be represented.
- DAX time intelligence functions such as TOTALYTD, SAMEPERIODLASTYEAR, and DATESBETWEEN expect a real, continuous date table to work correctly.
A dedicated, purpose-built date table replaces this hidden complexity with a single, transparent, reusable table that every fact table filters through giving consistent, predictable results across the entire report.
What Makes a Table a “Proper” Date Table
Before it can be marked as the official date table, Microsoft's modeling guidance specifies that the table must meet a precise set of structural requirements. These are non-negotiable missing even one will prevent the table from being marked correctly or will cause time intelligence functions to return misleading results.
| Requirement | Why It Matters |
| One column of type Date (or Date/Time) | This is the key column the model uses to build relationships and evaluate time filters. |
| Unique date values | Duplicate dates break the one-to-many relationship the date table must maintain with fact tables. |
| No blank values | A BLANK date breaks filter propagation and can cause functions to miscount rows. |
| No missing dates (fully contiguous) | Gaps in the sequence make rolling averages, running totals, and week-over-week logic unreliable. |
| Spans complete years | Year-based functions such as TOTALYTD and SAMEPERIODLASTYEAR assume the table covers full fiscal or calendar years. |
A “full year” does not have to mean January through December. If an organization reports on a fiscal calendar, the date table simply needs to cover complete fiscal years consistently the same structural rules still apply.
Method 1: Building a Date Table with DAX
The fastest way to create a date table directly inside Power BI is with a DAX calculated table, using either CALENDAR or CALENDARAUTO.
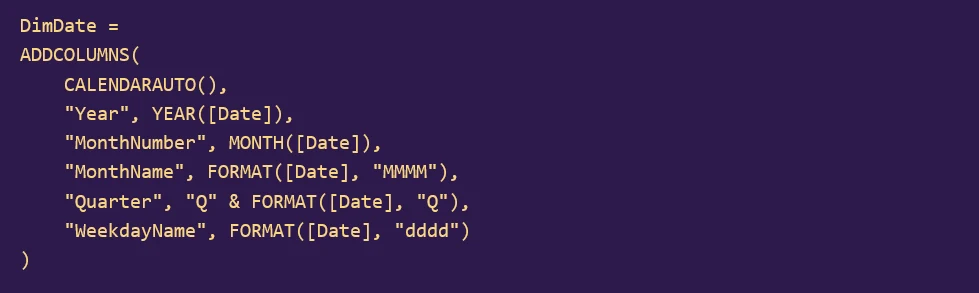
Using CALENDARAUTO
CALENDARAUTO scans every date column already present in the data model and automatically builds a continuous range covering the earliest to the latest date it finds. It is the quickest option when the model's date range should simply follow the underlying data.
Using CALENDAR
CALENDAR gives explicit control over the start and end dates, which is the safer choice when the model contains unrelated date columns (such as a customer birth date) that should not influence the calendar's range.
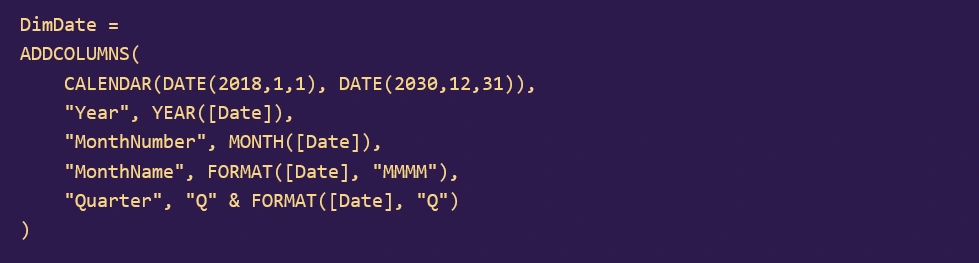
Extending the end date a year or two beyond today's date is a common practice it ensures forecast, budget, and what-if visuals always have valid rows to bind to instead of hitting missing dates at the edge of the range.
Method 2: Building a Date Table in Power Query
Building the calendar in Power Query (M language) instead of DAX has one major advantage: the table is materialized during data load rather than recalculated by the DAX engine, which can be lighter on larger models. It also integrates naturally with dataflows for enterprise-wide reuse.
The core building block is the List.Dates function, which generates a sequential list of dates from a start date, a count, and a step size.
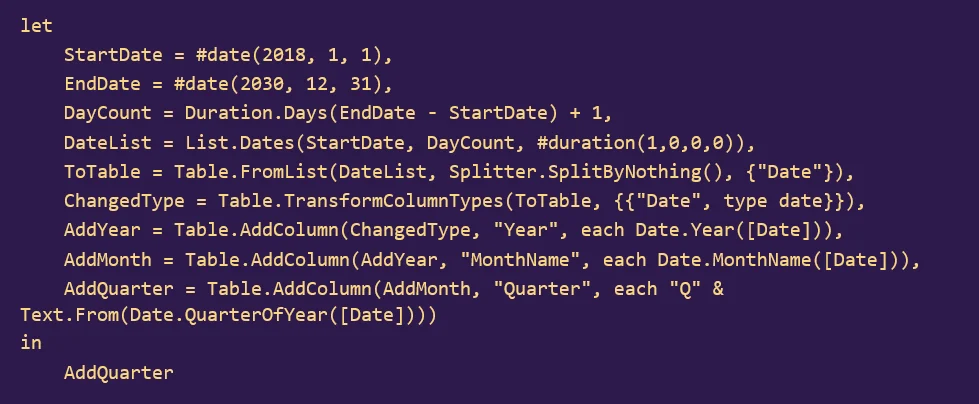
Calculating the day count dynamically, as shown above with Duration.Days, is safer than hardcoding a fixed number such as 365 it automatically accounts for leap years without any manual adjustment.
A Power Query built date table only works in Import mode. If a dataset uses DirectQuery, the DAX calculated-table approach must be used instead, since Power Query Transformations are not re-evaluated at query time.
Adding the Columns That Make It Useful
A bare list of dates is only the starting point. The real value of a date table comes from the descriptive columns that let report authors filter, group, and sort by meaningful time periods without writing a new DAX measure every time.
- Year, Month Number, and Month Name the fundamentals every report uses.
- Quarter and Fiscal Quarter essential for organizations that report on a non-calendar fiscal year.
- Week Number and Weekday Name needed for operational and retail-style reporting.
- Sort-helper columns (such as Month Number) bound to their text columns via Sort by Column, so “January, February, March” displays correctly instead of alphabetically.
- Relative flags such as “Is Current Month” or “Is Current Year” for default report views.
For organizations with a fiscal year that doesn't start in January, the fiscal columns are typically calculated from a single configurable parameter the fiscal year-end month so the entire calendar shifts automatically if that policy ever changes.
Marking It as the Official Date Table
Creating the table, in either DAX or Power Query, only adds a new table to the model it does not yet unlock time intelligence. That requires one final, often-overlooked step: explicitly marking the table as the model's official date table.
- In Power BI Desktop, select the table in the Fields pane.
- Open the Table tools ribbon and choose Mark as date table.
- In the dialog box, select the column containing the unique, contiguous date values, then confirm.
This action tells the DAX engine that the selected column is a verified, gapless, unique date series. Power BI validates the data at this point — if there are duplicate or missing dates, marking will fail with a clear error, which doubles as a useful data-quality check. Once a table is marked, Power BI removes its auto-generated hidden date hierarchies for that column, and any relationship built from a fact table's date column into this table gains full support for time intelligence functions such as TOTALYTD, SAMEPERIODLASTYEAR, and DATESBETWEEN.
Marking the date table is what separates “a table that happens to contain dates” from “the table the DAX engine trusts for every time-based calculation.” Skipping this step is one of the most common causes of time intelligence functions silently returning incorrect totals.
Common Things to Avoid
| Things | Consequence |
| Building more than one date table in the same model | Visuals filtered by different date tables can show inconsistent totals for the same period. |
| Leaving Auto Date/Time enabled | Creates hidden duplicate hierarchies that add size and confuse report authors. |
| Hardcoding a fixed day count | Leap years silently shift or truncate the calendar range. |
| Multiple active relationships from one fact table | The model only allows one active relationship per pair of tables; extra date columns need inactive relationships activated with USERELATIONSHIP. |
| Ending the range at today's date | Forecast, budget, and what-if visuals lose rows to bind to at the edge of the range. |
Best Practice Checklist
- Use exactly one date table for the entire model, related to every fact table's date column.
- Disable Auto Date/Time under File → Options and settings → Data Load.
- Extend the end date a year or two into the future to support forecasting.
- Add sort-by columns for every text-based date field (month name, weekday name).
- Mark the table as the official date table immediately after building it.
- For enterprise environments, publish the date table once as a shared dataflow so every report connects to the same, centrally maintained Calendar.
Conclusion
A date table is a small, unglamorous piece of a data model but it is also one of the few components that almost every report depends on, directly or indirectly. Investing the time to build it correctly, following the structural requirements, choosing the right build method for the workload, and explicitly marking it as official, pays off every time a stakeholder asks a question that involves “last quarter”, “year to date”, or “compared to last year”.