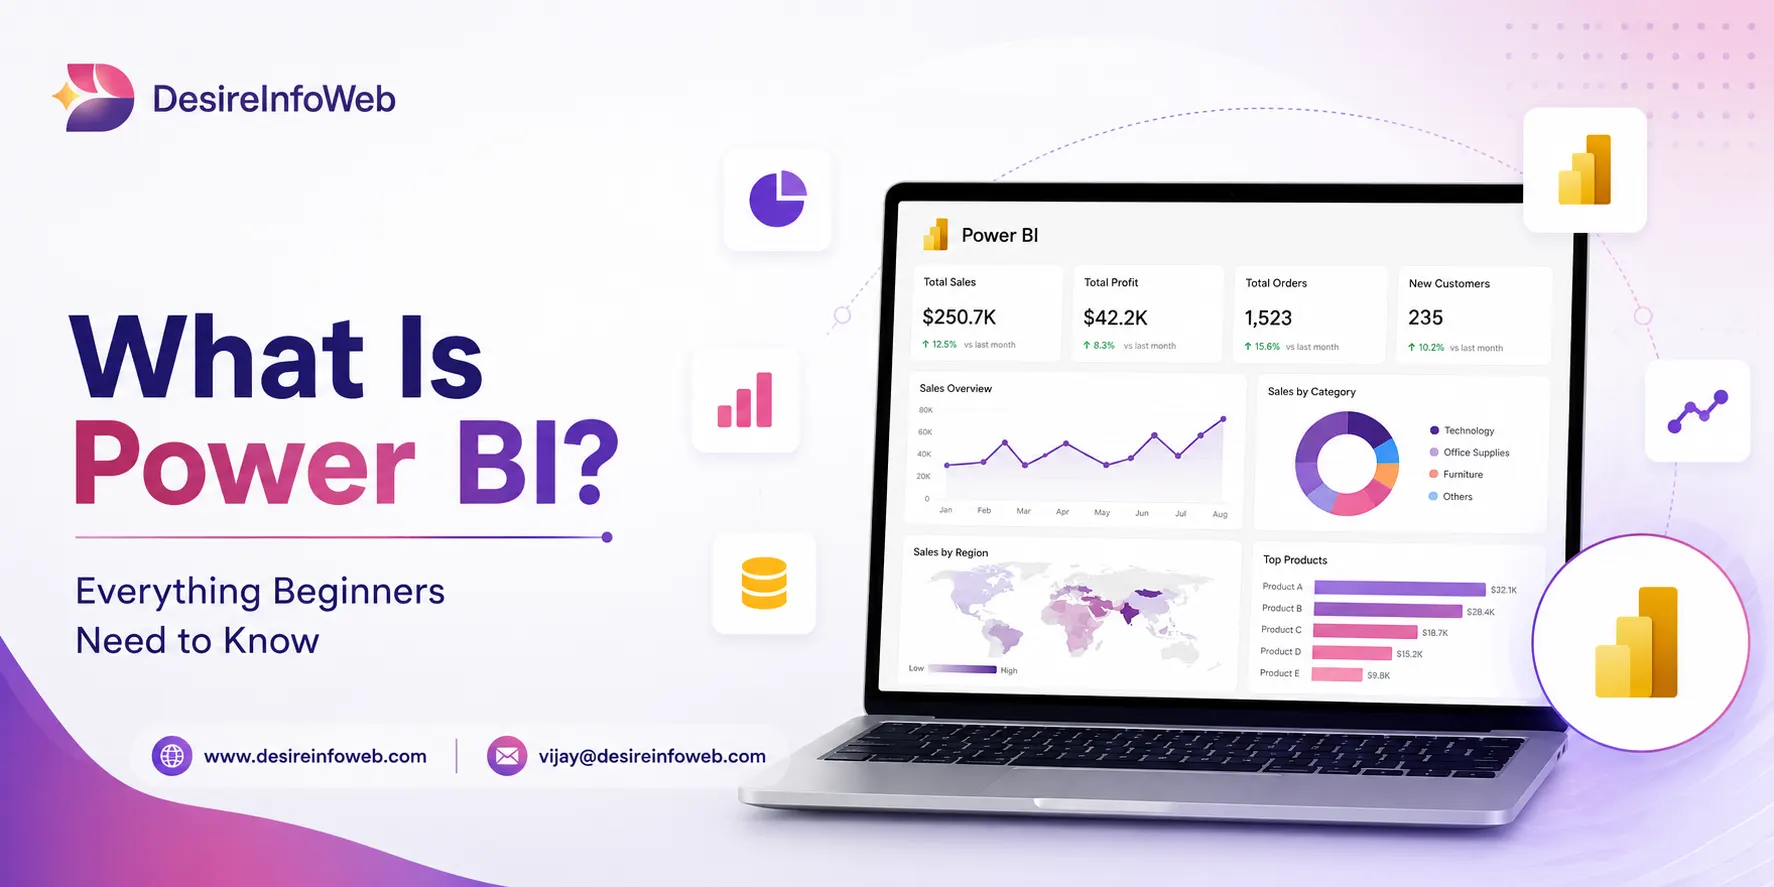
Power BI is not one app it's five connected tools. Power BI Desktop builds reports, the Power BI Service publishes and shares them, Power BI Mobile displays them on phones, Power BI Report Server hosts them on-premises, and Microsoft Fabric supplies the underlying data platform. Desktop is free; sharing through the Service usually needs a Pro or Premium license.
The Power BI ecosystem at a glance
“Power BI” isn't one application. It's five pieces that each handle a different step of the same job: build a report, publish it, and let people view it wherever they are. If you've searched What is Power BI and come away more confused than when you started, here's the whole map at a glance.
About Desire InfoWeb
We're a web and data services team that builds dashboards, websites, and reporting systems for small and mid-sized businesses. Power BI is one of the tools we implement most often for clients who want clear, live visibility into their sales, operations, or marketing numbers without hiring a full in-house analytics team.
The journey a report takes, start to finish:
| Desktop → Service → Mobile → Report Server → Fabric |
Excel vs Power BI vs Tableau, quickly
| Tool | What it is |
| Excel | A spreadsheet. Great for one-off calculations and small static tables — not built for live, refreshing dashboards over large datasets. |
| Power BI | Connects to many data sources, models how they relate, and turns the result into interactive dashboards that refresh on a schedule. |
| Tableau | Does the same core job as Power BI. The real difference is ecosystem and cost — Power BI leans on Microsoft 365 integration and cheaper licensing. |
The Five Pieces of Power BI, explained
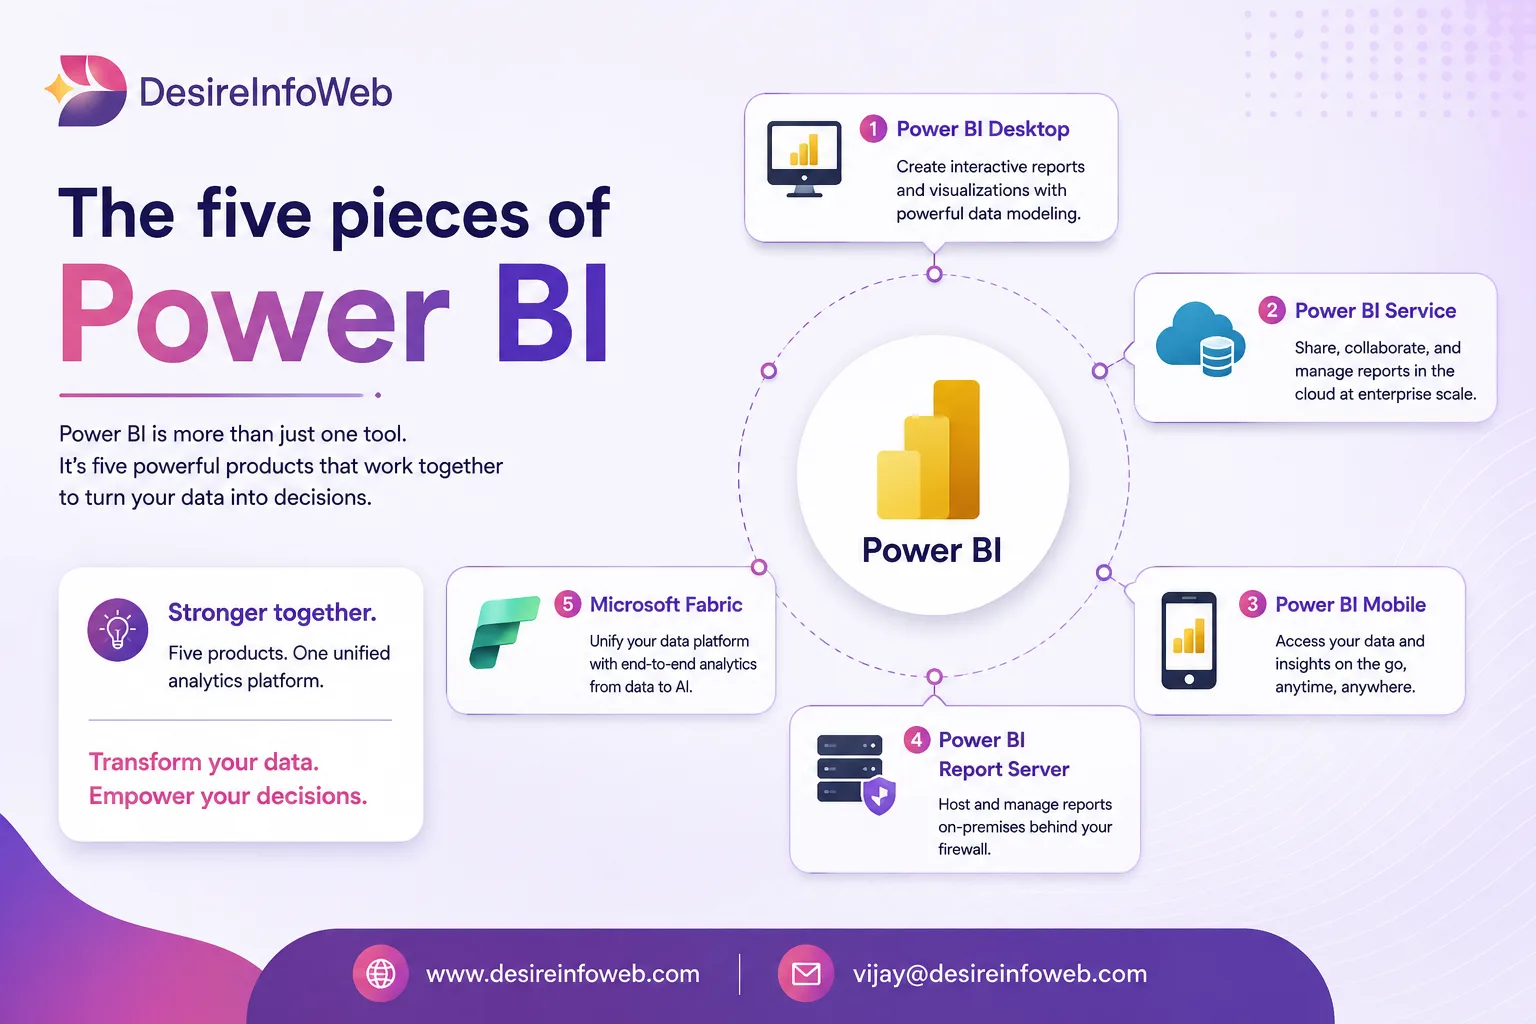
Power BI Desktop
The free Windows app where reports get built: connect to data, shape it with Power Query, model relationships, write DAX, design visuals. It's the workshop, not the showroom — nobody outside your team usually sees it directly.
Power BI Service
The cloud home for published reports at powerbi.com. It hosts team workspaces, packages reports into apps, manages scheduled refreshes, and is where most people actually open dashboards from a browser.
Power BI Mobile
The companion app for iOS, Android, and Windows. Same published reports, laid out for a small screen — built for checking numbers on the go, not for building models.
Power BI Report Server
An on-premises stand-in for the Service, for teams that can't put reports in the cloud due to regulation or policy. It's built on the same base as SQL Server Reporting Services.
Microsoft Fabric
Fabric is Microsoft's unified data platform engineering, warehousing, and real-time analytics, all sharing one storage layer called OneLake. Power BI wasn't replaced by it; Power BI became Fabric's reporting layer, now able to read OneLake data directly. Power BI is the dashboard, Fabric is the plumbing feeding it.
Advantages and disadvantages of Power BI
Before you commit to Power BI, it helps to know where it genuinely earns its reputation and where it falls short. Here's a balanced look based on how most teams actually experience it.
Advantages
- Deep integration with Excel, Teams, and the rest of Microsoft 365 familiar for anyone who already uses those tools.
- Strong price-to-value ratio; per-user Pro licensing is generally cheaper than comparable tools like Tableau.
- A large library of built-in and community-made visuals, plus hundreds of data connectors.
- Frequent monthly feature updates, with growing Copilot and AI-assisted report-building capabilities.
- Scales from a free desktop tool up to enterprise-grade Fabric capacity without switching products.
Disadvantages
- A meaningful learning curve for DAX formulas and proper data modeling beyond basic charts.
- Power BI Desktop is Windows-only Mac users need a browser, virtual machine, or cloud PC to author reports.
- Row-level security and governance can get complicated once several teams and workspaces are involved.
- Licensing tiers (Free, Pro, Premium, Fabric capacity) can be genuinely confusing to plan and budget for.
- Performance can suffer on very large or poorly modeled datasets without deliberate optimization.
How the pieces actually connect
A typical report's journey, start to finish:
- Build: An analyst builds the report in Power BI Desktop, connecting to data that may itself live in Fabric's One Lake.
- Publish: It's published to a workspace in the Service, scheduled to refresh, and packaged into an app or to Report Server if it must stay on premises.
- View: Colleagues open the app from a browser or Power BI Mobile, wherever they are, whenever they need the numbers.
Which one do you actually need?
| If you need to… | Use… |
| Build reports and data models | Power BI Desktop |
| Share with a team, schedule refreshes, distribute an app | Power BI Service (Pro license) |
| Check dashboards on your phone | Power BI Mobile |
| Keep everything on-premises for compliance | Power BI Report Server |
| Manage large-scale data engineering or real-time analytics | Microsoft Fabric (Power BI on top) |
Conclusion
Power BI isn't a single product it's a small ecosystem where Desktop builds, the Service shares, Mobile and Report Server deliver, and Fabric supplies the data underneath it all. Once you know which piece does which job, the “what is Power BI” confusion mostly disappears, and the licensing and setup decisions get a lot easier to make.
If you're evaluating Power BI for your own business, start small: build one report in Desktop, publish it to the Service, and see whether it answers the question you actually needed answered. Everything else in the ecosystem Mobile, Report Server, Fabric only becomes relevant once that first report is already earning its keep. And if you'd rather have someone set that foundation up correctly the first time, our team can help you plan and build it.
Frequently asked questions
Is Power BI free to use?
Yes, Power BI Desktop is free to download and use for building reports. Sharing and collaborating on those reports through the Power BI Service generally requires a Pro license per user, and larger organizations often move to Premium capacity instead.
Do you need to know how to code to use Power BI?
No, coding is not required for basic reports. Power BI Desktop's drag-and-drop interface handles most of the work. Advanced users write DAX formulas and Power Query M code for custom calculations, but neither is mandatory to get started.
What is the difference between Power BI Pro and Premium?
Pro is a per-user license mainly for sharing and collaborating on reports. Premium is capacity-based and licensed for the whole organization rather than per user, unlocking larger datasets, more frequent refreshes, and features like Report Server.
Does Power BI work with Excel?
Yes, Power BI can import Excel workbooks directly, refresh data from Excel files stored in OneDrive or SharePoint, and even publish Excel-based reports straight to the Power BI Service.
What is Microsoft Fabric and how does it relate to Power BI?
Microsoft Fabric is Microsoft's unified data platform for engineering, warehousing, and real-time analytics. Power BI now serves as Fabric's reporting layer, reading data directly from Fabric's shared storage layer, OneLake.
Can I use Power BI on a Mac?
Power BI Desktop is Windows-only, so Mac users can't install it natively. Options include running it through a virtual machine, a cloud PC, or simply using the browser-based Power BI Service to view and edit reports.