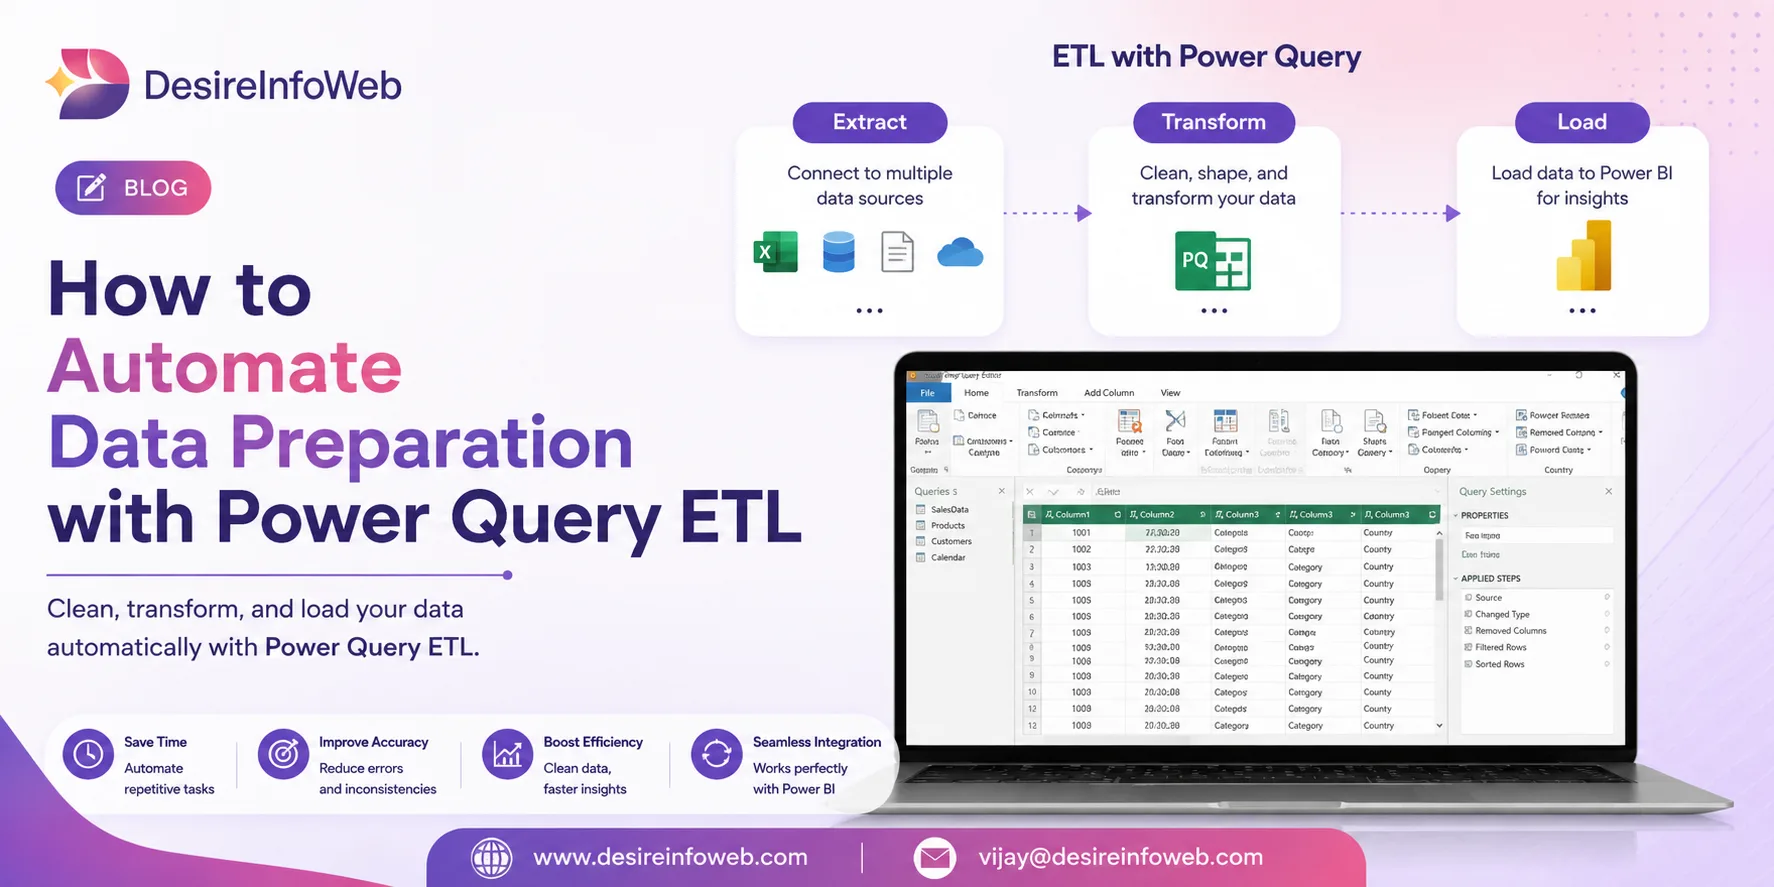
Every analytics project starts the same way with raw, messy, inconsistent data scattered across spreadsheets, databases, and cloud apps. Before a single chart or dashboard can be trusted, that data has to be found, cleaned, and reshaped into something usable. This is the quiet, unglamorous work that decides whether an entire analytics effort succeeds or stalls and it is exactly the problem that ETL, and tools like Power Query, were built to solve.
Industry research has repeatedly pointed to the same uncomfortable truth: business users and analysts spend much of their time preparing data rather than analyzing it, according to a widely cited 2017 IDC survey referenced in industry ETL literature. Power Query ETL exists to shrink that gap turning a slow, manual chore into a repeatable, low-code pipeline that anyone on an engineering or analytics team can build and maintain.
What is ETL?
ETL stands for Extract, Transform, Load. It describes the three-stage process organizations use to move data from scattered source systems into a single, structured destination where it can be analyzed, reported on, or fed into other applications. The concept isn't new its roots trace back to the rise of databases in the 1970s but it remains the backbone of nearly every modern data and BI workflow.
| Stage | What Happens | Typical Examples |
| Extract | Raw data is retrieved from one or more source systems. | Excel files, SQL databases, APIs, SharePoint, cloud apps |
| Transform | Data is cleaned, reshaped, standardized, and enriched so it is analysis-ready. | Removing duplicates, splitting columns, fixing data types, merging tables |
| Load | The transformed data is delivered into its destination for reporting or downstream use. | Power BI model, Excel workbook, data warehouse, dataflow |
Enter Power Query
Power Query is Microsoft's built-in data transformation and preparation engine. It provides a visual, point-and-click editor for connecting to data sources and applying transformations no coding required to get started, though advanced users can drop into its underlying scripting language, called M, for finer control.
One of Power Query's biggest strengths is consistency across products. The same engine and interface power Power Query in Excel, Power BI Desktop and Service, Power BI Dataflows, Microsoft Fabric, Azure Data Factory wrangling dataflows, and SQL Server Analysis Services. Learn the tool once, and the skill transfers everywhere it appears.
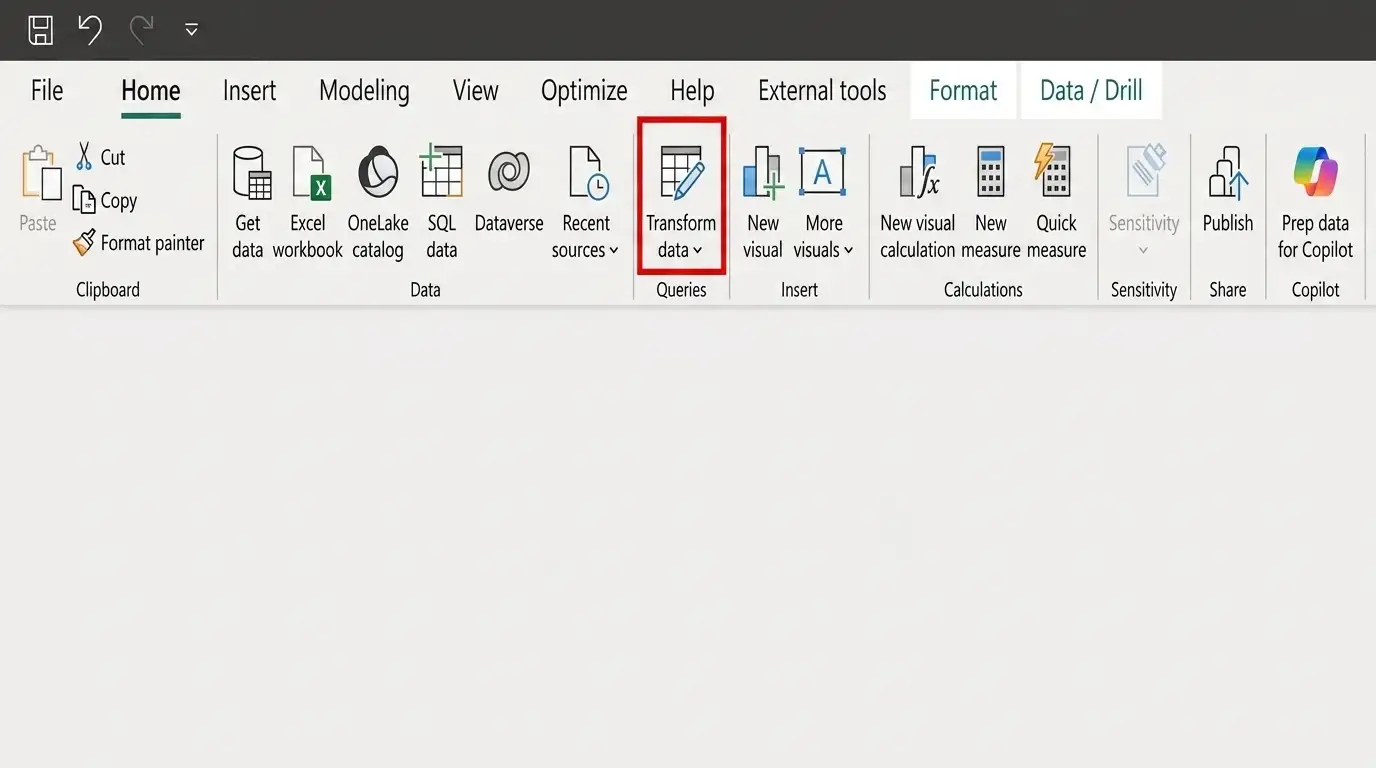
Everything so far has been interface tour and theory. This is the “prove you can do something” checkpoint a small, complete win before the concepts get heavier in later posts.
How Power Query Maps to ETL
Power Query mirrors the classic ETL stages directly, which is what makes it approachable to anyone already familiar with the concept:
- Extract: Power Query connects to dozens of source types, from Excel workbooks and CSV files to SQL Server, SharePoint lists, and web APIs, and pulls in a live or snapshot copy of the data.
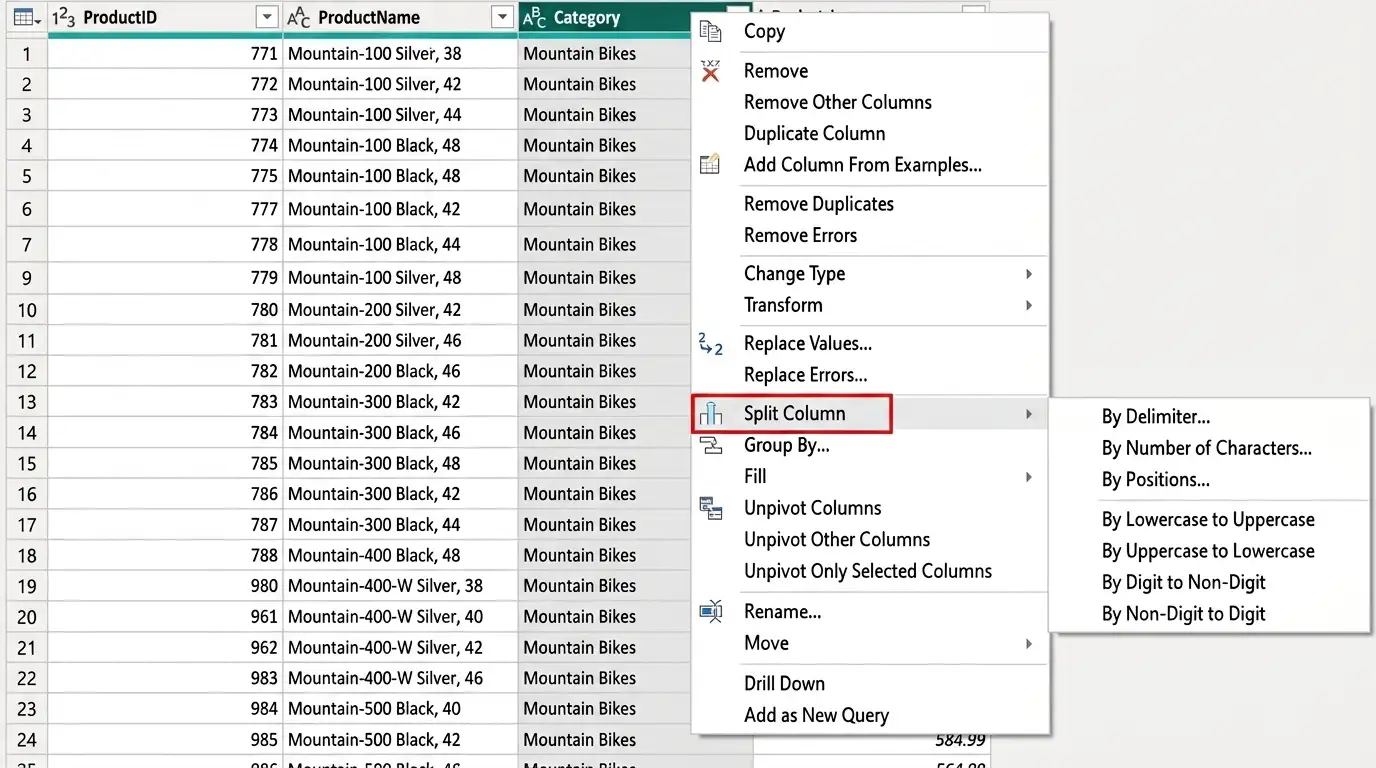
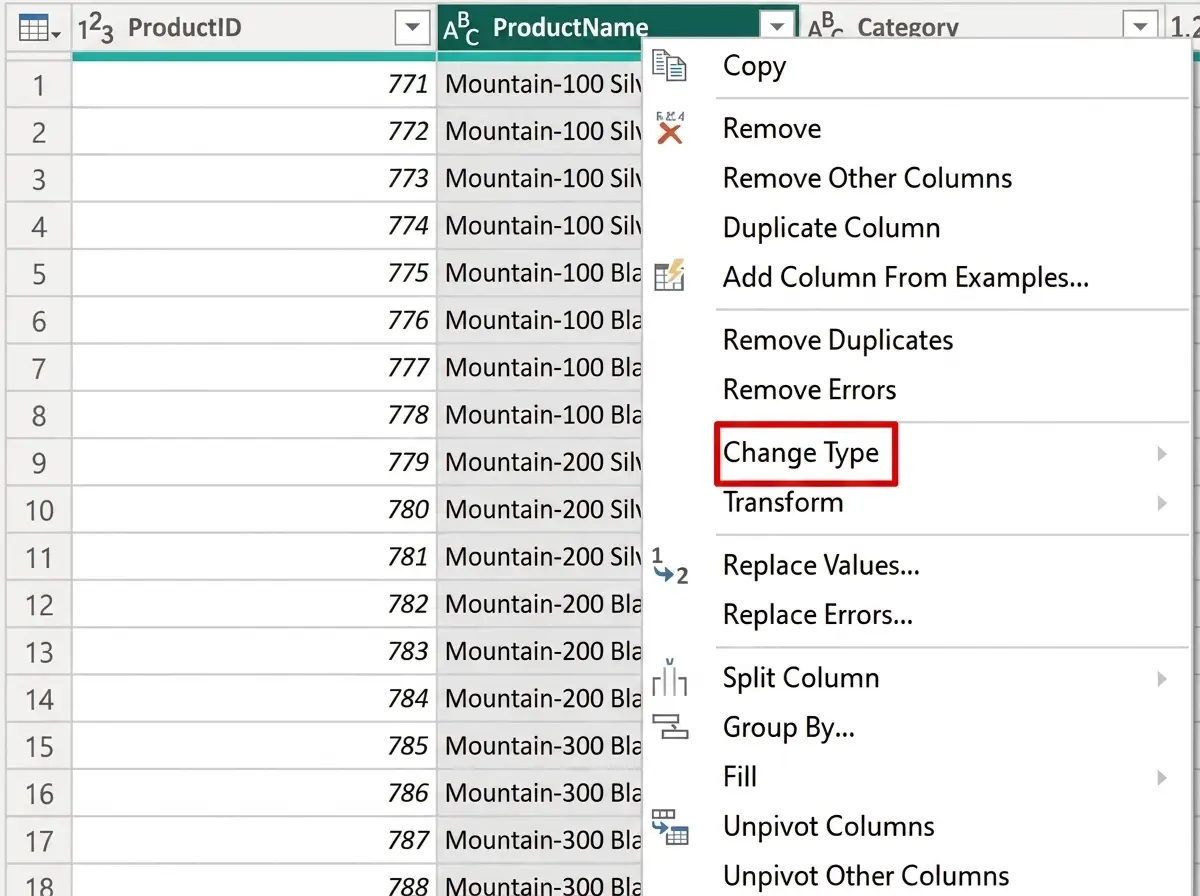
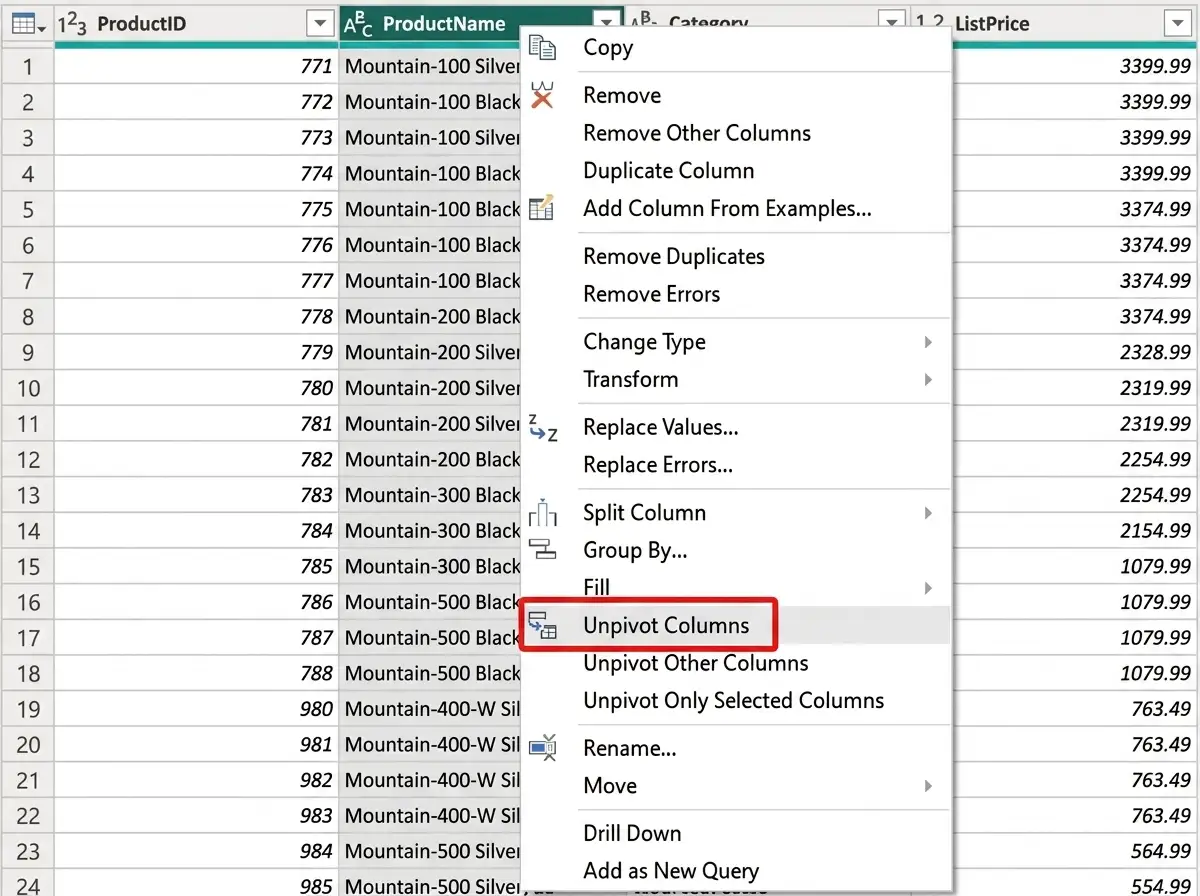
- Transform: Inside the Power Query editor, users apply transformations such as removing columns, splitting text, changing data types, pivoting or unpivoting tables, and merging or appending queries.
- Load: With a single "Close & Load" action, the transformed dataset is delivered into an Excel table, a Power BI data model, or a dataflow destination, ready for analysis.
A Note on the M Language
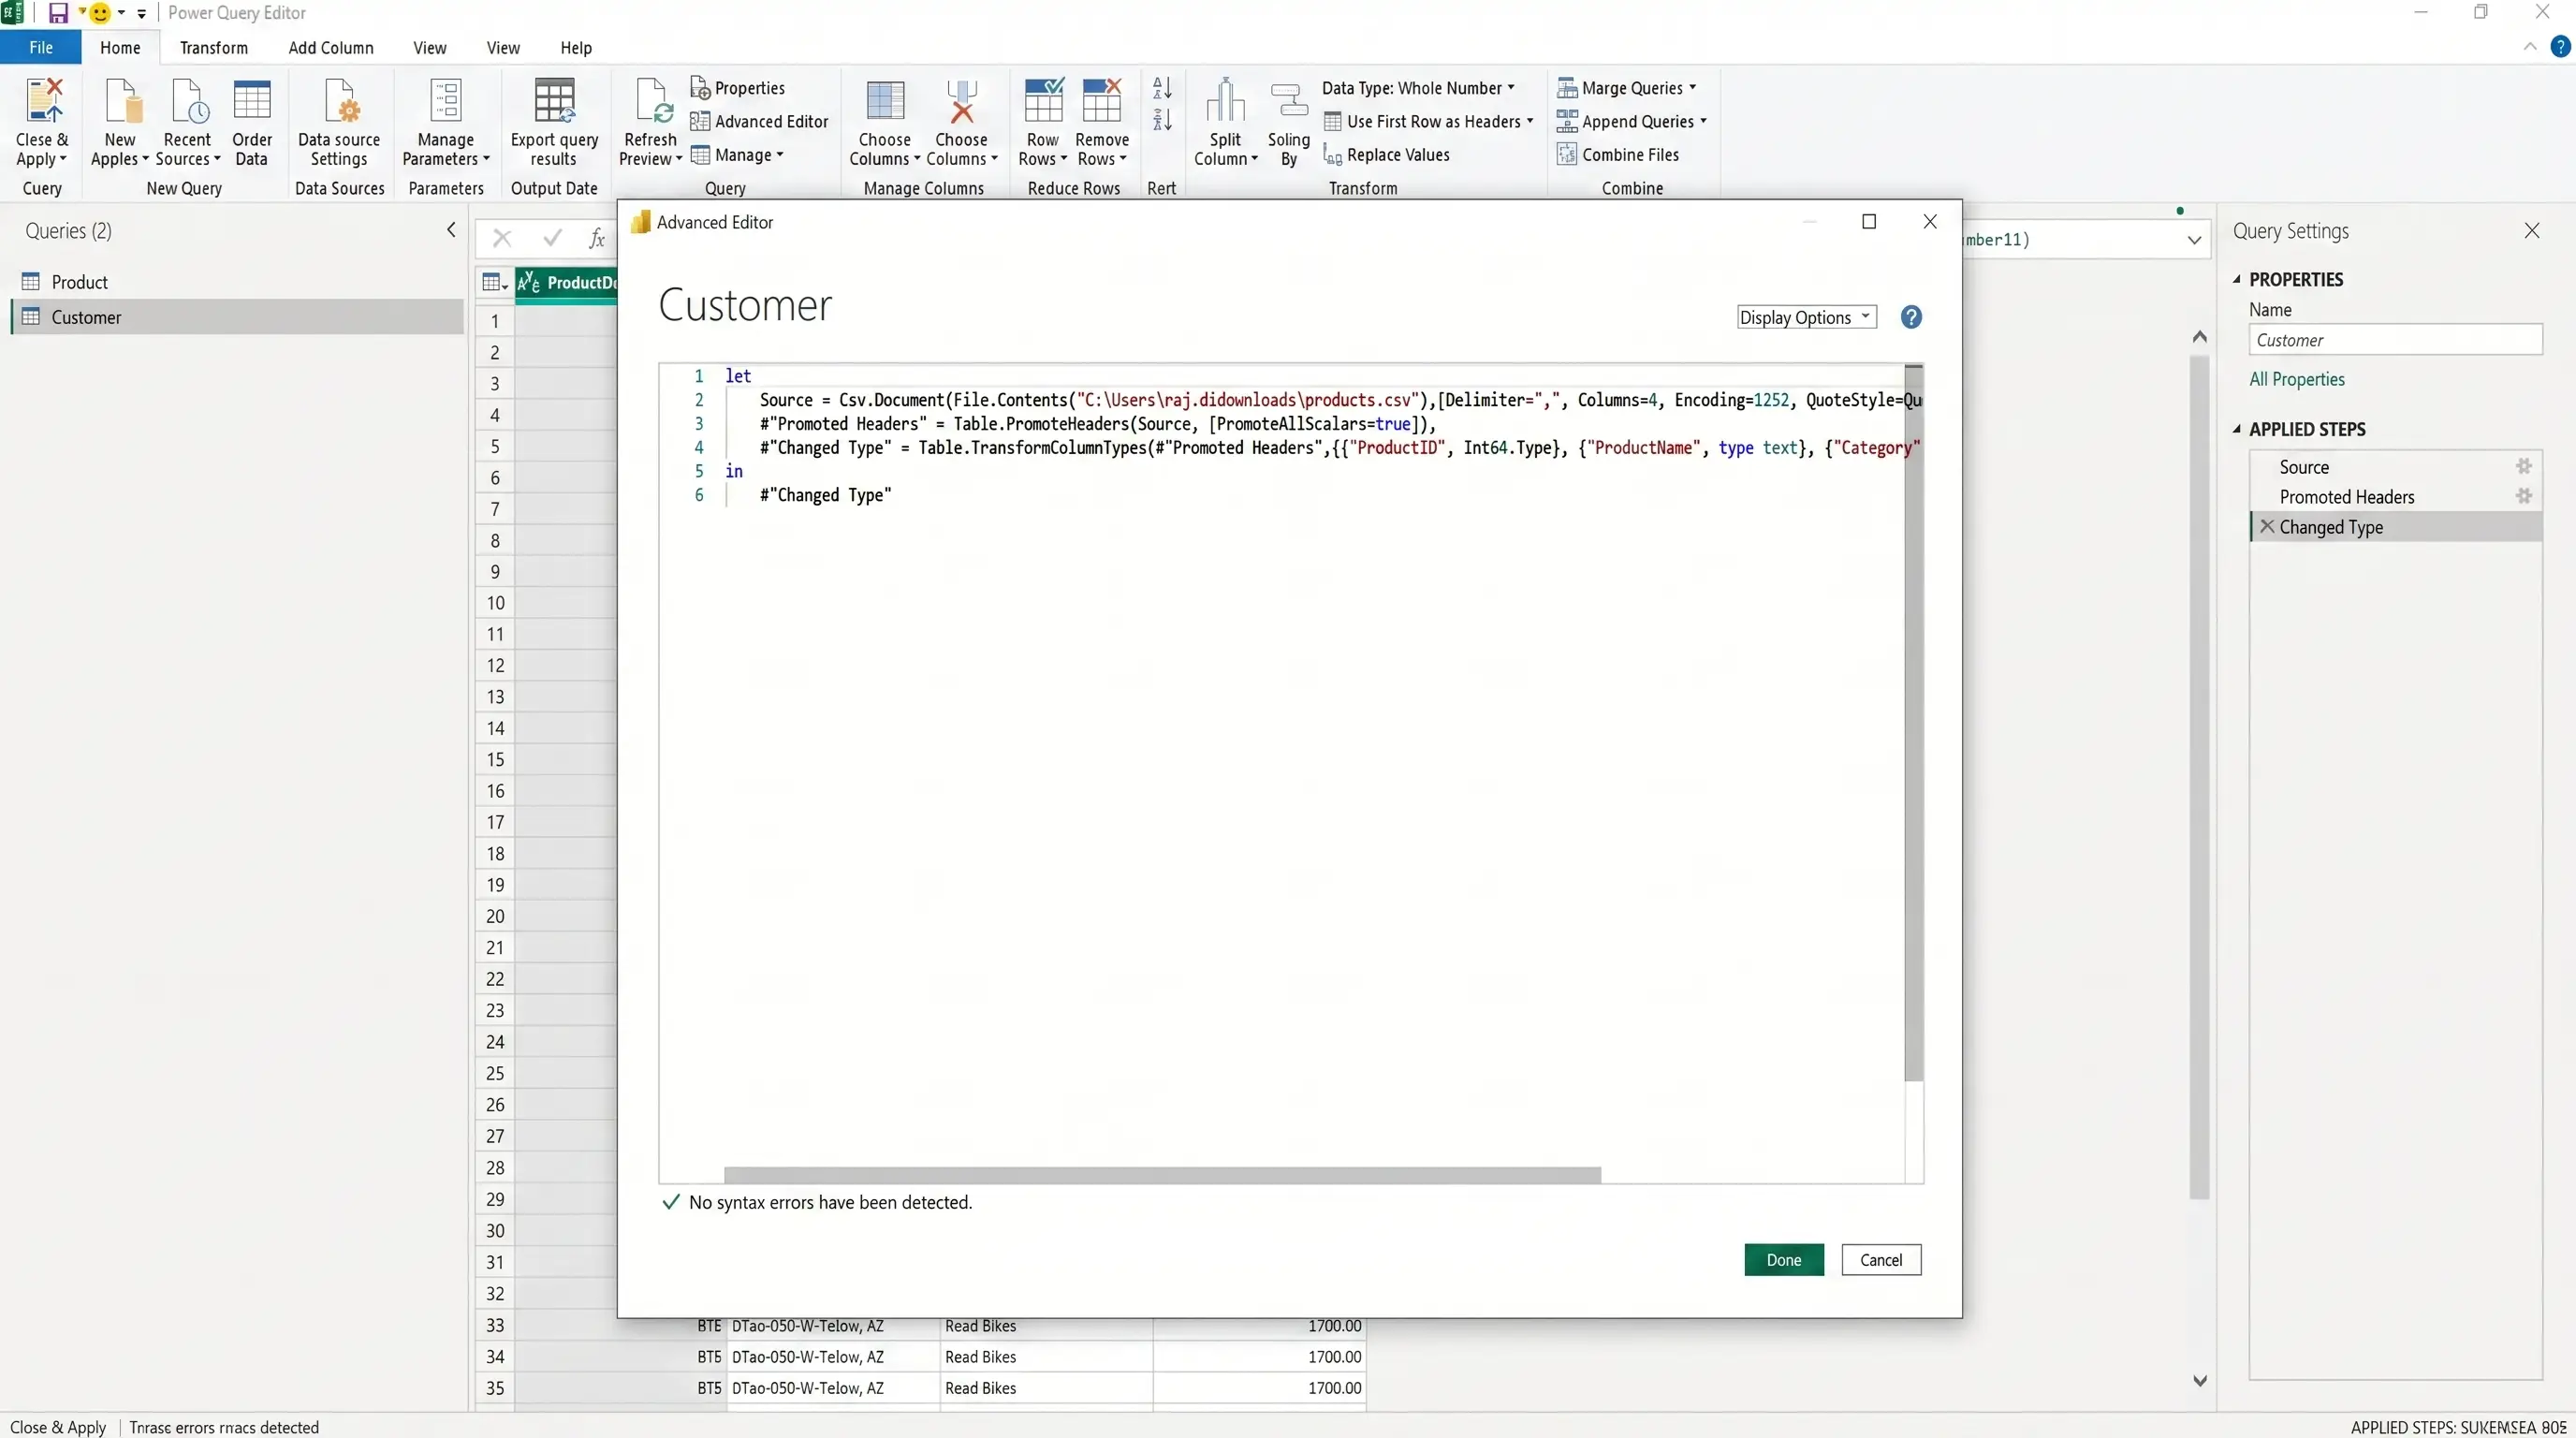
Every transformation applied through the graphical interface is automatically translated into M, Power Query's functional data transformation language. Most users never need to touch it, but for advanced scenarios custom functions, conditional logic, or transformations the UI doesn't expose the Advanced Editor gives direct access to the M script behind any query.
Why It Matters
Power Query's value isn't just technical convenience it changes who can participate in data preparation and how reliably that work gets done:
- Low-code accessibility: Hundreds of built-in transformations are available through menus and ribbons, removing the need for custom scripts for most everyday data cleaning tasks.
- Repeatability: Every step is recorded, so refreshing a report re-applies the exact same transformation logic to new data automatically.
- Self-service analytics: Business users and analysts can prepare their own data without waiting on a dedicated data engineering pipeline for every request.
- Cross-platform consistency: The same skills and queries carry across Excel, Power BI, Fabric, and Azure Data Factory dataflows.
- Reduced Errors: Automating repetitive cleaning steps cuts down on the manual copy-paste mistakes that creep into spreadsheet-based workflows.
Power Query vs. Traditional ETL Tools
| Aspect | Traditional ETL (SSIS, Informatica) | Power Query |
| Skill required | Often requires dedicated developers or coding | Low-code, UI-driven, accessible to analysts |
| Setup | Complex workflows and infrastructure | Built directly into Excel, Power BI, and Fabric |
| Best fit | Large-scale, enterprise data warehousing | Departmental, self-service, and mid-scale reporting needs |
Common Transformations to Know
- Removing duplicates and blank rows
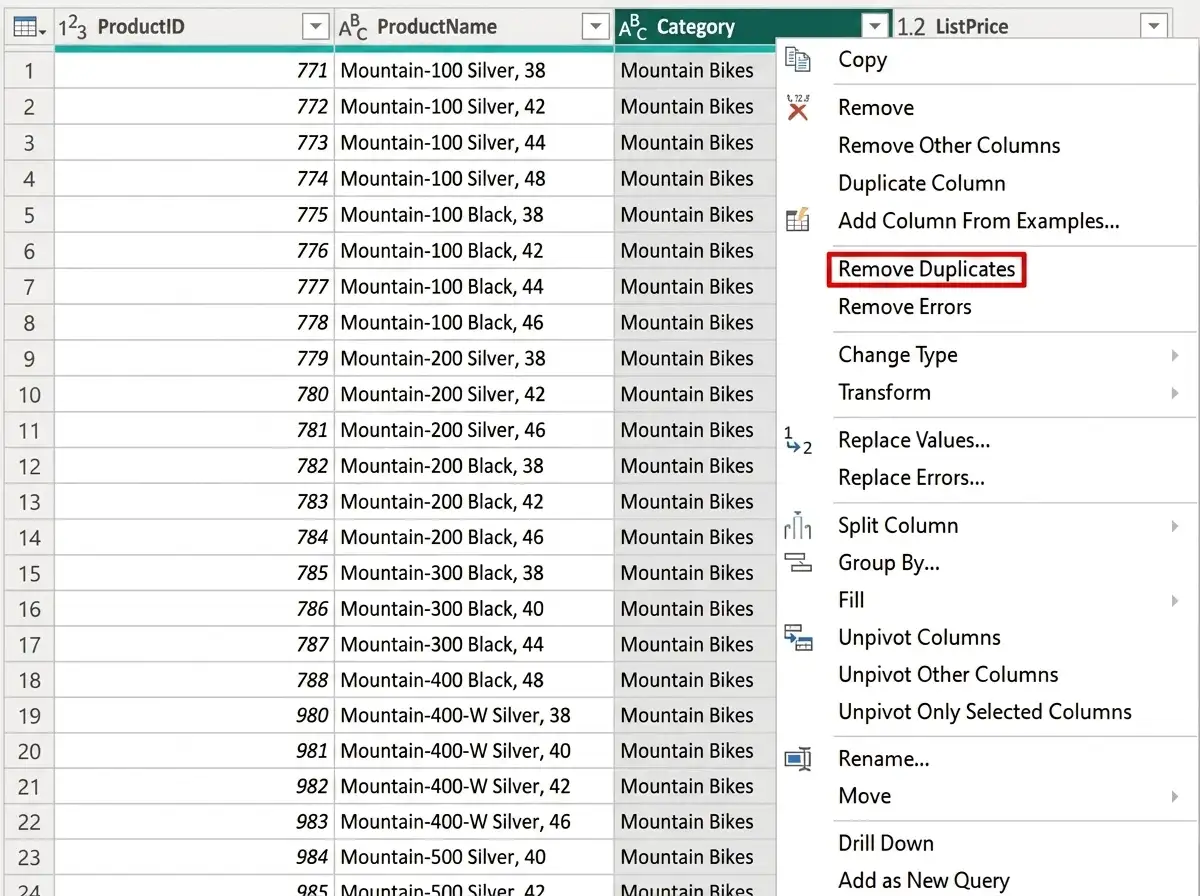
- Splitting or merging columns
- Changing data types and fixing formatting inconsistencies
- Pivoting and unpivoting tables to reshape data
- Merging and appending queries from multiple sources

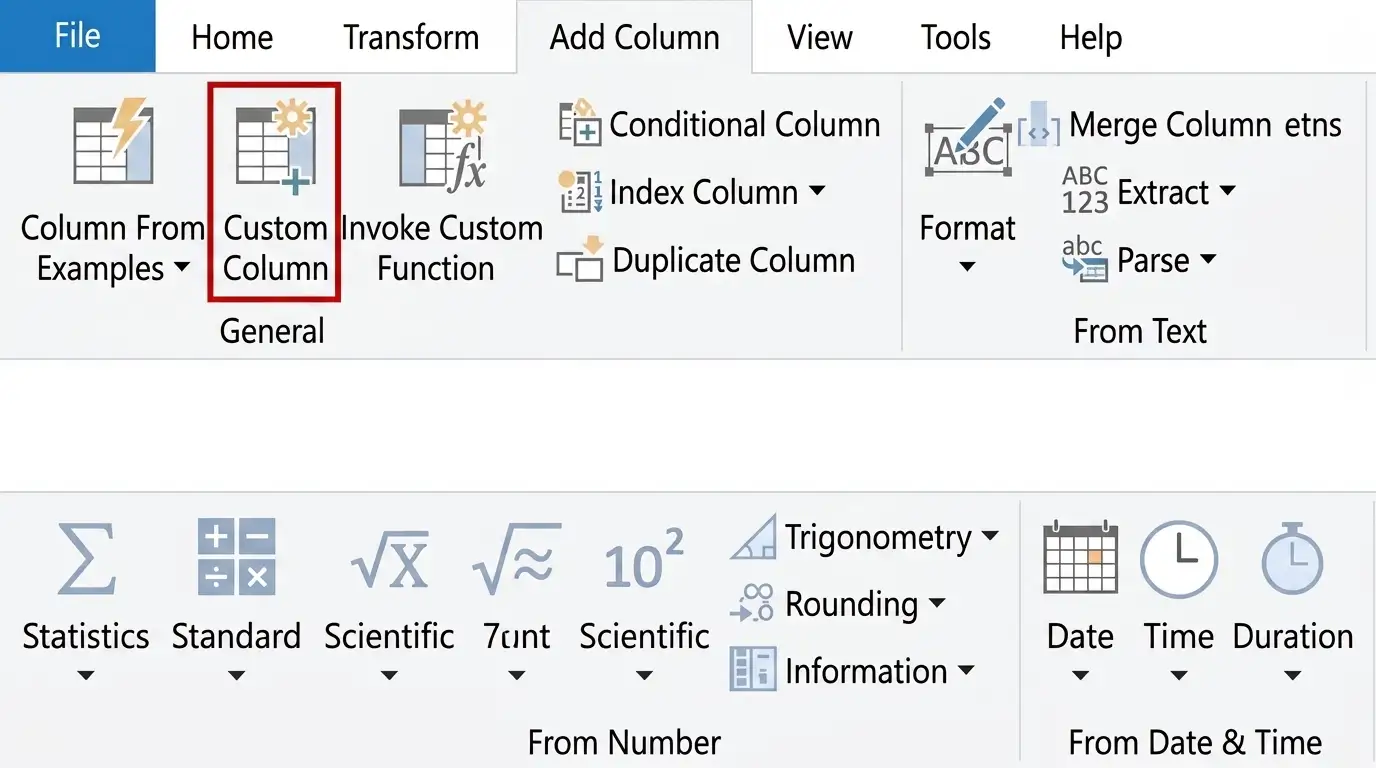
- Adding calculated or conditional columns
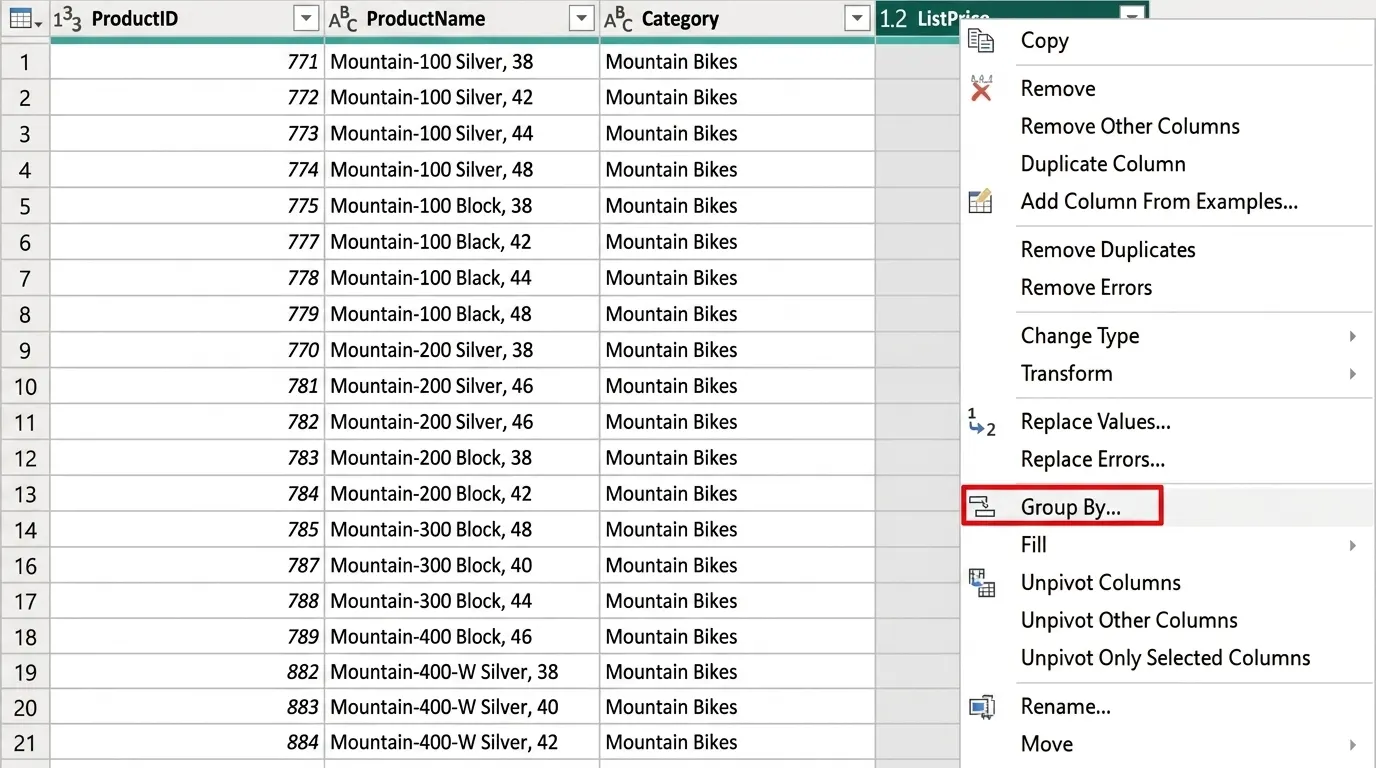
- Grouping and aggregating data
Closing Thoughts
ETL is not a niche data-engineering concept it's the foundation of every trustworthy report and dashboard. Power Query takes that foundation and makes it accessible, repeatable, and consistent across the Microsoft data ecosystem. Whether you're cleaning a single spreadsheet or feeding an enterprise data model, understanding Extract, Transform, and Load and how Power Query implements it is one of the most practical skills an engineering or analytics professional can build.