Introduction
Every Power BI developer eventually encounters a calculation that returns an unexpected result, a slicer that does not filter a visual correctly, or a measure that behaves differently across report pages. In many cases, the problem comes from one of the DAX Mistakes in Power BI, rather than from the DAX engine itself.
From circular dependencies and incorrect filter directions to missed context transitions, confusing row context with filter context, or choosing SUM when SUMX is required, these mistakes can affect both calculation accuracy and report performance. Understanding the common symptoms and knowing how to troubleshoot each issue can make DAX debugging much faster.
The Most Common DAX Mistakes at a Glance
Mistake | Typical Symptom |
Circular dependencies | Model refuses to calculate; error referencing the measure/column itself somewhere in its own dependency chain. |
Wrong filter direction | A slicer or filter on one table has no effect on a visual - or affects the wrong table entirely. |
Forgetting context transition | A measure inside FILTER, calculated column, or iterator returns the same total for every row instead of a row-specific value. |
Confusing row context and filter context | SUMX or other iterators return unexpected totals because a column reference isn't being filtered as expected. |
Misusing ALL / ALLSELECTED / REMOVEFILTERS | Percent-of-total or year-over-year measures ignore slicers, or ignore the wrong slicers. |
SUM instead of SUMX for row-by-row math | A calculation that should multiply row-by-row before summing instead sums each column separately, giving an inflated or wrong result. |
Unhandled blanks and divide-by-zero | Visuals show error glyphs or unexpected 0s/blanks instead of clean numbers. |
Mistake 1: Circular Dependencies
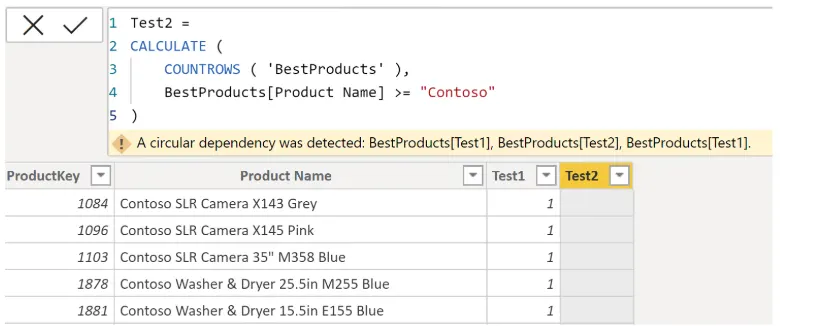
A circular dependency happens when a measure or calculated column depends - directly or through a chain of other measures - on itself. DAX cannot resolve a value that depends on its own result, so the engine throws an error instead of calculating.
How It Happens
- A calculated column references a measure that, somewhere down its dependency chain, references that same column.
- Two measures reference each other (Measure A calls Measure B, and Measure B calls Measure A).
- A UDF or calculation group item calls back into a measure that depends on that same calculation group.
How to Debug It
- Use Power BI's model/dependency tools or external tools such as DAX Studio to trace the dependency chain. You can also use INFO.CALCDEPENDENCY() where supported to investigate calculation dependencies.
- Temporarily hardcode a suspect reference with a constant value to confirm which link in the chain is circular.
- Break the cycle by extracting the shared logic into its own separate measure or DAX UDF that neither side calls back into.
Mistake 2: Wrong Filter Direction
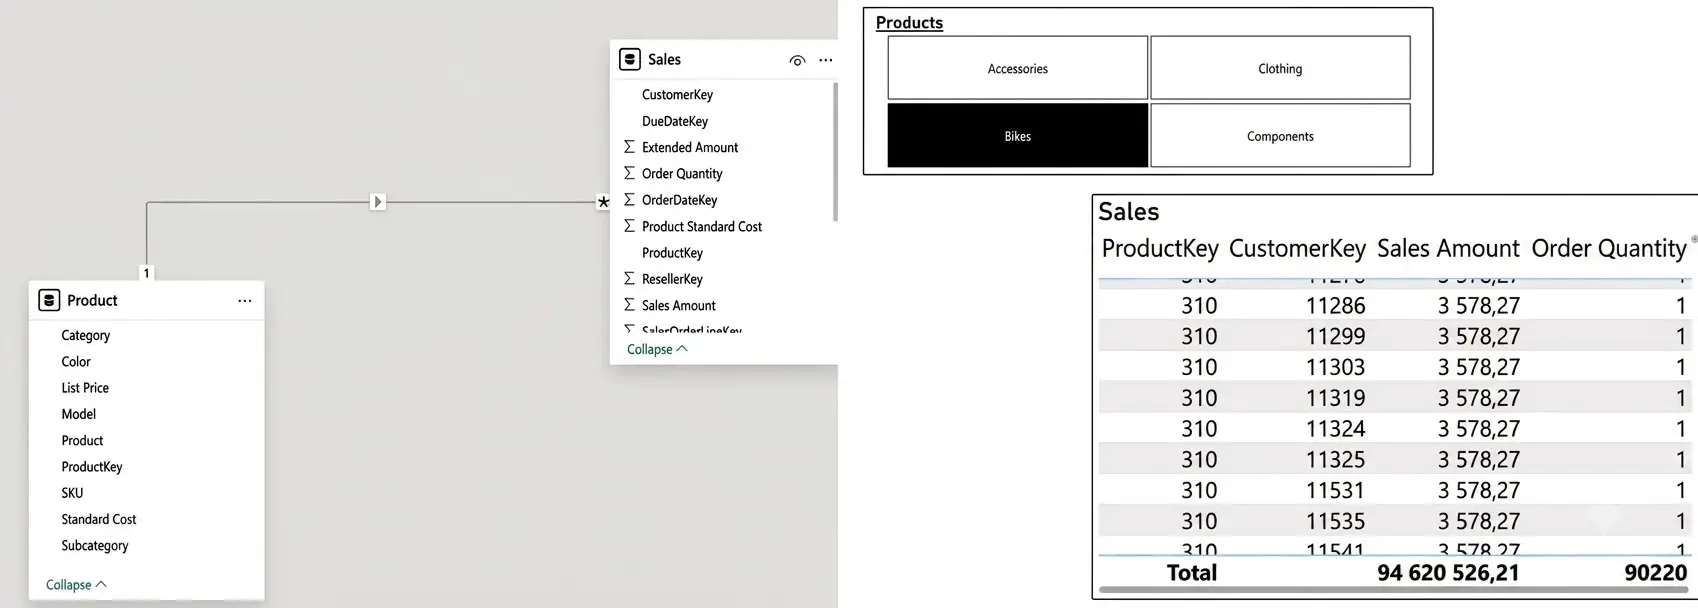
Relationships in Power BI filter in a specific direction. By default, a one-to-many relationship filters from the “one” side to the “many” side. When a slicer built on the wrong table has no visible effect - or a bidirectional relationship causes unexpected cross-filtering across an unrelated table - the cross-filter direction is almost always the cause.
How It Happens
- A slicer is built from a dimension table that isn't on the filtering side of its relationship to the fact table.
- A bidirectional relationship was enabled to fix one report page, but it silently changes filter behavior on every other page that shares the same table.
- Multiple fact tables share a dimension, but only one relationship is marked active, so a filter appears to do nothing against the inactive path.
How to Debug It
- Open the Model view diagram and check the arrow direction and active/inactive status on every relationship touching the tables involved.
- Use USERELATIONSHIP() inside a test measure in DQV to force the inactive relationship and confirm whether that's the missing filter path.
- Prefer single-direction filtering wherever possible; reserve bidirectional relationships for specific, well-tested many-to-many scenarios.
Mistake 3: Forgetting Context Transition
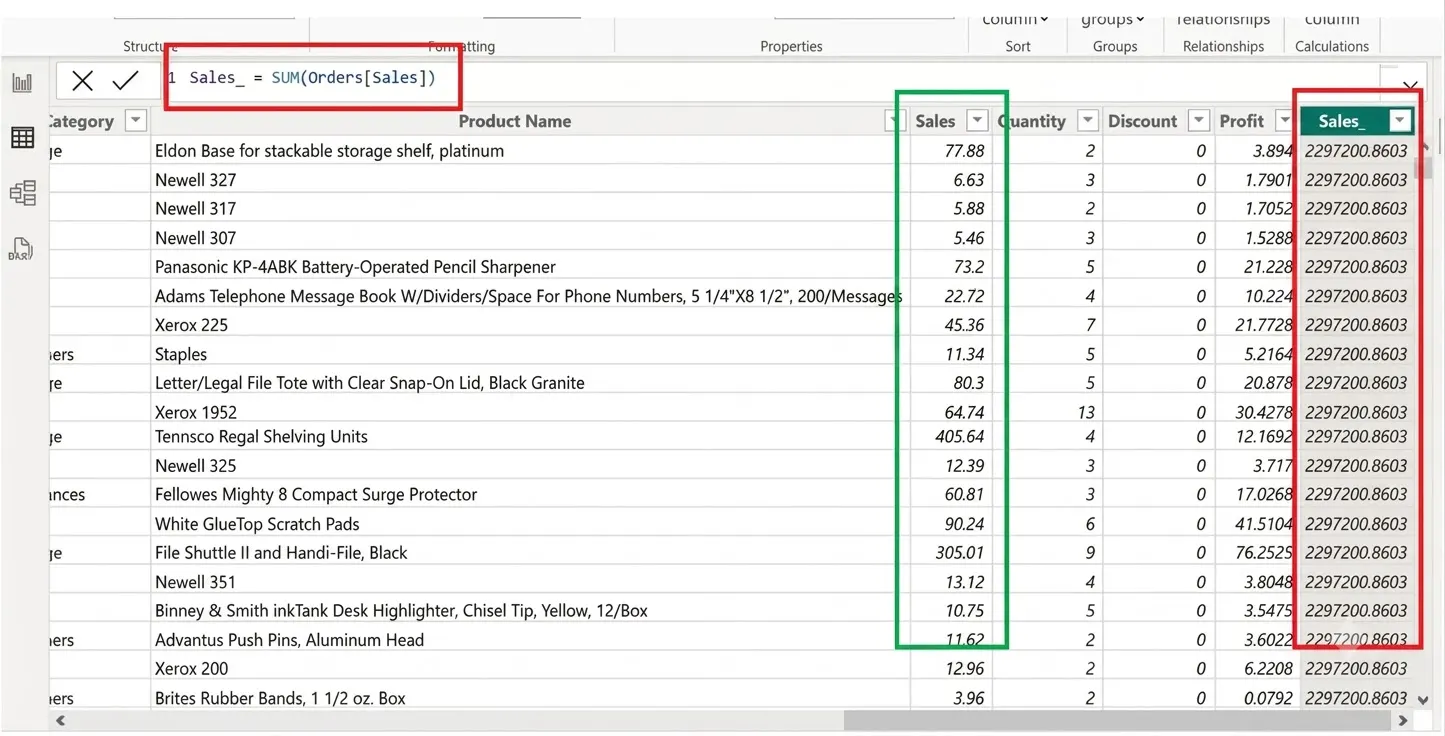
This is the single most common source of “why is every row showing the same number?” bugs. Row context (the current row while iterating a table) does not automatically become filter context. CALCULATE is what converts the current row context into filter context - this conversion is called context transition. Forget to wrap an expression in CALCULATE where it's needed, and a calculated column or iterator will evaluate every row using the full table's filter context instead of that row's own values.

How to Debug It
- If a calculated column or iterator shows the identical value on every row, suspect a missing context transition first.
- Remember that simply referencing a measure inside an iterator already triggers context transition, because measures are implicitly wrapped in CALCULATE - the bug usually appears when referencing raw columns or variables instead of measures.
- Test the row-level behaviour directly in DQV using EVALUATE with ADDCOLUMNS to see the value produced for a handful of individual rows.
Mistake 4: Confusing Row Context and Filter Context
Row context exists automatically inside calculated columns and iterator functions like SUMX, FILTER, and ADDCOLUMNS - it means “DAX is currently looking at one specific row.” Filter context is the set of filters coming from slicers, visuals, and CALCULATE - it means “DAX is currently restricted to this subset of the data.” Mixing the two up is behind many mismatched totals.
- A column reference inside an iterator uses row context automatically - you don't need CALCULATE just to read a column value row by row.
- A measure reference inside an iterator uses filter context, because measures always run inside their own CALCULATE.
- SUMX ( Sales, Sales[Quantity] * Sales[Unit Price] ) is a row-context calculation; SUMX ( Sales, [Total Sales] ) is a filter-context calculation once context transition applies.
Mistake 5: Misusing ALL, ALLSELECTED, and REMOVEFILTERS
Function | What It Actually Removes |
ALL() | ALL() Removes filters from the specified table or column within the calculation. Use it when you need to compare against a broader or full total. |
ALLSELECTED() | ALLSELECTED() -- Removes filters from inside the visual, but keeps filters that come from slicers and the report page. |
REMOVEFILTERS() | Functionally similar to ALL, but with clearer, explicit naming - preferred in modern DAX for readability. |
How to Debug It
- If a percent-of-total measure ignores a slicer you expect it to respect, you probably need ALLSELECTED instead of ALL.
- If a measure still changes when it shouldn't, confirm you haven't left ALLSELECTED where a hard ALL/REMOVEFILTERS was needed.
Mistake 6: Using SUM Where SUMX Is Needed
SUM totals a single column. SUMX iterates row by row, evaluates an expression for each row, and then adds up the results - which is required whenever a calculation needs to multiply or combine multiple columns before summing.

Mistake 7: Unhandled Blanks and Divide-by-Zero Errors
Ratio and average measures often break the moment a denominator can be zero or blank, producing error glyphs in visuals instead of clean numbers.

- Always prefer DIVIDE() over the / operator for anything that could divide by zero.
- Decide deliberately whether a blank should display as 0, as blank, or be hidden - inconsistent blank handling is a common source of “why does this total look different on two pages” complaints.
Conclusion
Most “wrong number” problems in Power BI trace back to a short list of recurring mistakes: a circular reference, a relationship filtering the wrong way, or a missed context transition. Learning to recognize the symptom of each one - and having a repeatable debugging framework - turns a frustrating afternoon of guesswork into a five-minute fix.
Frequently Asked Questions
Why does my calculated column show the same value for every row?
This is the classic symptom of a missing context transition. If the column references a raw table expression instead of a measure (which auto-wraps in CALCULATE), wrap the expression in CALCULATE yourself so it evaluates per row instead of across the whole table.
Why doesn't my slicer affect this visual?
Check the relationship between the slicer's table and the visual's table in Model view. If the relationship filters in the wrong direction, or the active relationship path doesn't include that table, the slicer will have no effect.
What's the difference between ALL and ALLSELECTED?
ALL removes every filter, including slicers, producing a true grand total. ALLSELECTED keeps slicer and page-level filters but removes filters from inside the visual itself, which is usually what you want for a percent-of-selected-total calculation.
Why is my measure slow as well as wrong?
Slow and incorrect measures are frequently linked - an unnecessary bidirectional relationship or an overused FILTER() instead of a simpler boolean filter argument can both hurt performance and produce unexpected filter behaviour at the same time.