Introduction
Time-based analysis is one of the most common requirements in Power BI, whether you need to track year-to-date sales, compare performance with the previous year, or analyze results across different periods. Power BI Time Intelligence Functions make these calculations easier by allowing you to shift, compare, and accumulate date-based data directly within your DAX measures.
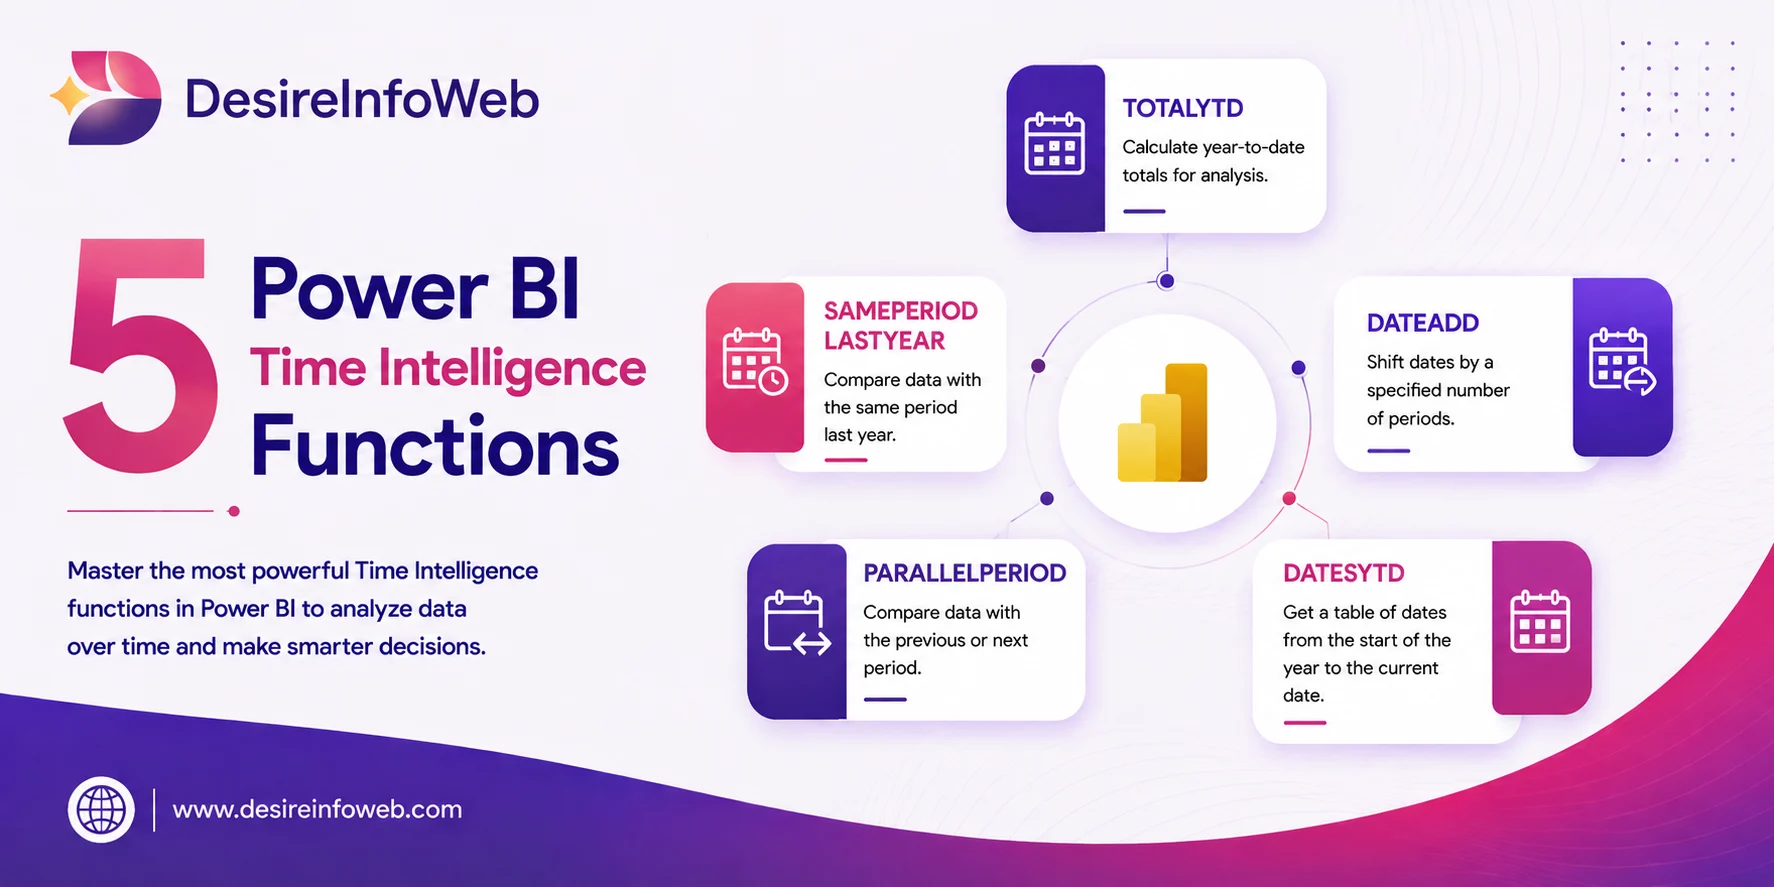
In this guide, we'll explore five essential functions TOTALYTD, SAMEPERIODLASTYEAR, DATEADD, PARALLELPERIOD, and DATESYTD using the same monthly Sales dataset throughout. The before-and-after examples show exactly how each function changes the calculation, helping you understand when to use each function for YTD calculations, year-over-year comparisons, prior-period analysis, and more.
Detailed Function Breakdown (with Before/After Examples)
Every example below uses the same sample dataset a monthly Sales table spanning 2023 and 2024 so readers can see the exact same data change shape under each function. This consistency is what makes the before/after comparison land.
Sample Table: Sales by Month
Month | Year | Sales Amount |
January | 2023 | $10,000 |
February | 2023 | $12,000 |
March | 2023 | $9,000 |
April | 2023 | $8,000 |
May | 2023 | $11,000 |
June | 2023 | $14,000 |
January | 2024 | $14,000 |
February | 2024 | $16,000 |
March | 2024 | $11,000 |
April | 2024 | $13,000 |
May | 2024 | $15,000 |
June | 2024 | $17,000 |
TOTALYTD
TOTALYTD adds up a measure from the start of the current calendar or fiscal year through the latest date in context, resetting automatically at each year boundary.
DAX FORMULA

Side-by-Side: Before → After
BEFORE Single Month in Context | AFTER TOTALYTD Applied |
June 2024 $17,000 one month's value only | YTD Sales (Jan–Jun 2024) $86,000 cumulative running total |
SAMEPERIODLASTYEAR
SAMEPERIODLASTYEAR shifts the current date selection back exactly one year, keeping the period length identical. It's the standard building block for any year-over-year growth measure.
DAX FORMULA
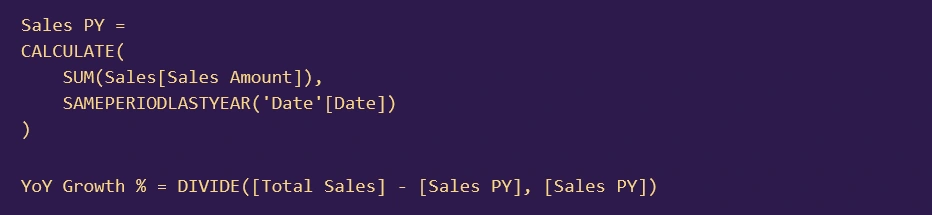
Side-by-Side: Before → After
BEFORE Current Period (H1 2024) | AFTER SAMEPERIODLASTYEAR Applied |
January – June 2024 $86,000 this year's total so far | January – June 2023 $64,000 YoY Growth = 34.4% |
DATEADD
DATEADD moves the date context forward or backward by any number of days, months, quarters or years a day-for-day shift rather than a full-period shift. It's the most flexible general-purpose time-shifting function in DAX.
DAX FORMULA

Side-by-Side: Before → After
BEFORE Current Quarter (Q2 2024) | AFTER DATEADD(-1, QUARTER) Applied |
April – June 2024 $45,000 Apr + May + Jun | January – March 2024 $41,000 shifted back one full quarter |
PARALLELPERIOD
PARALLELPERIOD looks similar to DATEADD, but it always snaps to whole calendar periods even if the current selection is only a partial month or quarter. That difference matters whenever a report is filtered mid-period.
DAX FORMULA

Side-by-Side: Before → After
BEFORE Partial Q2 2024 Selection | AFTER PARALLELPERIOD Applied |
April – May 2024 only $28,000 quarter is not yet complete | Full Q1 2024 (Jan–Mar) $41,000 returns the entire prior quarter |
DATESYTD
DATEADD shifts the current date selection by a specified number of days, months, quarters, or years while preserving the shape of the selected period. DATESYTD returns a table of dates that can be combined with CALCULATE and additional filter expressions, giving you more flexibility when building complex measures.
DAX FORMULA

Side-by-Side: Before → After
BEFORE TOTALYTD (No Extra Filter) | AFTER DATESYTD + CALCULATE Applied |
All Regions, Jan–Jun 2024 $86,000 one fixed calculation | North Region Only, Jan–Jun 2024 $52,000 extra filter stacked in the same measure |
Quick-Reference Comparison Table
Function | Returns | Typical Use | Resets Each Period? |
TOTALYTD | A number | Cumulative total from year start | Yes - every January 1st |
SAMEPERIODLASTYEAR | A table | Year-over-year comparisons | No - mirrors current selection |
DATEADD | A table | Flexible day/month/quarter/year shifts | No - shifts by exact interval |
PARALLELPERIOD | A table | Full-period prior comparisons | Yes - snaps to whole periods |
DATESYTD | A table | Building block inside CALCULATE | Yes - every year start |
Conclusion
Understanding Power BI Time Intelligence Functions is essential for building meaningful date-based analysis and comparing business performance across different periods. While TOTALYTD is useful for cumulative year-to-date calculations, SAMEPERIODLASTYEAR simplifies year-over-year comparisons, DATEADD provides flexible date shifting, PARALLELPERIOD works with complete calendar periods, and DATESYTD provides a flexible date table that can be combined with CALCULATE and additional filters.
The key is choosing the function that matches your analytical requirement. Once you understand how these five functions handle date context, you can build more reliable DAX in Power BI measures for YTD, YoY, quarterly, and other time-based business analysis in Power BI.