Introduction
Power BI is often straightforward when the requirement is simply to add a column or calculate an average. However, business reporting becomes more complex when the required result depends on a calculation performed for each row before producing the final value. Calculating revenue from quantity and unit price, finding an average transaction value, or creating a dynamic sales ranking are common examples.
This is where DAX iterator functions become important. Functions such as SUMX, AVERAGEX, and RANKX allow Power BI to evaluate an expression across a table or a group of values before returning the required result. Unlike standard aggregation functions, iterators work with row context, making them useful for calculations that cannot be handled by simply referencing a single column.
Understanding how these functions work can make a significant difference when building Power BI reports. It helps you choose between functions such as SUM and SUMX, understand when AVERAGEX is more appropriate than AVERAGE, and create rankings that respond correctly to filters and report context.
What Makes an Iterator Different?
DAX includes several iterator functions, such as SUMX, AVERAGEX, MINX, MAXX, and RANKX. These functions evaluate an expression across rows of a table or a set of items, creating row context during evaluation. Instead of operating on a single column all at once, an iterator scans a table row by row, evaluates an expression for each individual row, and only then combines those row-level results into a final answer.
This row-by-row scan creates something a plain aggregation never has: row context. Inside an iterator's expression, DAX knows exactly which row it's currently looking at, which means that expression can reference multiple columns, multiply them together, or call other measures - none of which a simple column aggregation like SUM or AVERAGE can do, because those functions only ever see one column at a time.
SUMX vs. SUM
SUM adds up the values already stored in one column. SUMX iterates a table, computes an expression per row, and adds up those computed results - which is required the moment a total depends on more than one column.

If your fact table doesn't store a pre-calculated Revenue column, SUM cannot calculate Quantity × Unit Price by itself. In the model, SUMX is the natural DAX choice for calculating the row-level revenue and then adding those results together.
AVERAGEX vs. AVERAGE
AVERAGE returns the mean of the values in one column. AVERAGEX evaluates an expression per row and then averages those computed results - useful whenever the thing you want to average isn't a stored column, but a calculation.

A common mix-up: AVERAGE ( Sales[Revenue] ) and AVERAGEX ( Sales, Sales[Quantity] * Sales[Unit Price] ) can look like they should return the same thing, but they only match if Revenue was already stored as exactly Quantity * Unit Price for every row. As soon as the calculation involves logic that isn't already a column, AVERAGEX is the only correct choice.
RANKX: Why Ranking Needs an Iterator
Unlike SUM/SUMX or AVERAGE/AVERAGEX, there's no plain “RANK” aggregation function in DAX - ranking is inherently a row-by-row comparison, so it can only be expressed as an iterator. RANKX evaluates an expression for every row (or every item) in a table and returns where the current row's value stands relative to all the others.

- <table>: the set of items being ranked - for example, ALL ( Salesperson[Salesperson] ) to rank every salesperson regardless of the current filter.
- <expression>: the measure or calculation being compared, such as [Total Sales].
- <order>: ASC or DESC - DESC (highest value = rank 1) is the default and the most common choice for leaderboards.
- <ties>: SKIP (default, leaves gaps after a tie) or DENSE (no gaps after a tie) - choose DENSE if you want consecutive rank numbers even when values tie.
Practical Example: Building a Sales Leaderboard
Step 1: The Base Measure

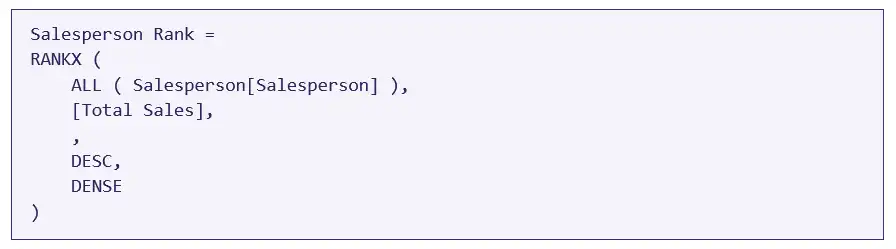
Step 2: The Rank Measure
ALL ( Salesperson[Salesperson] )removes the filter from the Salesperson column, allowing RANKX to compare all salespeople while retaining other filters in the current context, such as Region, Date, or Product.
Step 3: A Region-Scoped Leaderboard
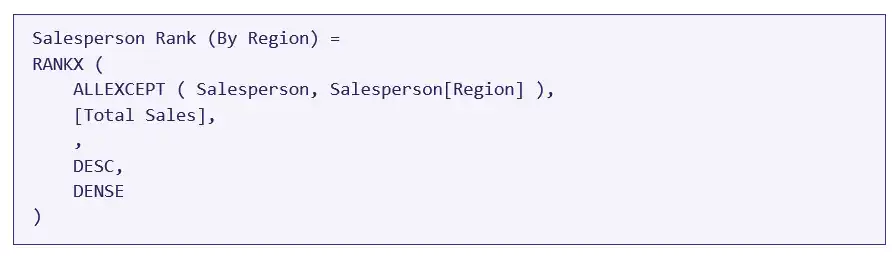
To rank salespeople only within their own region (a per-region leader board instead of a company-wide one), swap ALL for ALLEXCEPT so the region filter is preserved while the salesperson filter is removed:
Iterator vs. Non-Iterator: Side-by-Side
Non-Iterator | Iterator Equivalent | When You Need the Iterator |
SUM(column) | SUMX(table, expression) | The total depends on multiplying or combining more than one column per row. |
AVERAGE(column) | AVERAGEX(table, expression) | The value being averaged is a calculation, not a value already stored in a column. |
No non-iterator equivalent | RANKX(table, expression, ...) | Any time you need to compare one row's value against every other row's value - ranking is always row-by-row. |
Conclusion
SUMX, AVERAGEX, and RANKX exist because plain aggregations can only ever look at one column at a time. The moment a calculation needs to combine columns, compute a value that isn't already stored, or compare one row against every other row, an iterator is the only tool that can express it. Once the row-context mechanics click, iterators stop feeling like an edge case and start feeling like the natural way to write most non-trivial DAX.
DAX Functions in Power BI provide an important way to handle calculations that require more than a simple column aggregation. SUMX can calculate an expression for every row before adding the results, AVERAGEX can calculate an expression and return its average, and RANKX can compare values across a defined set of items to create meaningful rankings.
The most important distinction is understanding what the calculation needs to evaluate. If the required result already exists in a column, a standard function such as SUM or AVERAGE may be sufficient. If the result needs to be calculated for each row first, an iterator is often the better choice.
Frequently Asked Questions
Why does SUMX give a different result than SUM on a column I expected to match?
This usually means the stored column and the per-row calculation aren't actually equivalent for example, a stored Revenue column that was calculated with a different rounding rule or discount logic than Quantity multiplied by Unit Price. SUMX always reflects the expression you write, not what a similarly named column happens to contain.
Why does my RANKX measure always show rank 1 for every row?
This is almost always a missing ALL or ALLEXCEPT. Without removing the filter on the item being ranked, RANKX only ever compares the current row against itself inside the filtered context, so every row ranks first out of a table of one.
Is there a non-iterator version of RANKX?
No ranking requires comparing a row's value against other rows, which is inherently a row-by-row operation, so RANKX has no plain, non-X equivalent in DAX.