
Introduction
Power BI becomes significantly more powerful when you can turn business questions into reusable DAX measures. Whether you're comparing actual sales against a budget, measuring year-over-year growth, tracking cumulative performance, or understanding how each region contributes to total sales, the right DAX pattern can make these calculations simpler and more consistent.
Instead of creating a new formula for every report, learning a few proven DAX Patterns For Power BI gives you a reusable foundation for building effective business intelligence dashboards. In this guide, we'll explore four commonly used DAX patterns Variance, YoY Growth %, Running Total, and % of Total using practical examples and sample data.
By the end, you'll understand when to use each pattern, how the core DAX functions work together, and how to adapt these formulas to your own Power BI reports.
Our Sample Data
Table A - Region Performance
| Region | Actual Sales | Budget Sales |
| North | ₹1,04,500 | ₹90,000 |
| South | ₹54,000 | ₹60,000 |
| Grand Total | ₹1,58,500 | ₹1,50,000 |
Table B - Monthly Sales (2023 vs 2024)
| Month | Year | Sales Amount |
| January | 2023 | $10,000 |
| February | 2023 | $12,000 |
| March | 2023 | $9,000 |
| April | 2023 | $8,000 |
| January | 2024 | $14,000 |
| February | 2024 | $16,000 |
| March | 2024 | $11,000 |
| April | 2024 | $13,000 |
The Recipe Box
Recipe 1 · Variance
Reach for this the moment a stakeholder asks "how far off from budget are we?" It's the single most-requested measure pair in finance-facing reports.
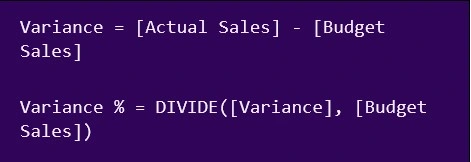
Region | Actual | Budget | Variance |
North | ₹1,04,500 | ₹90,000 | +₹14,500 (+16.1%) |
South | ₹54,000 | ₹60,000 | −₹6,000 (−10.0%) |
Grand Total | ₹1,58,500 | ₹1,50,000 | +₹8,500 (+5.7%) |
Swap in your own fields: any two comparable amount columns Actual vs Budget, this year vs forecast, plan vs commit fit the same two-line shape.
Recipe 2 · YoY Growth %
Reach for this whenever the question is "are we growing?" it's the backbone of almost every executive scorecard.
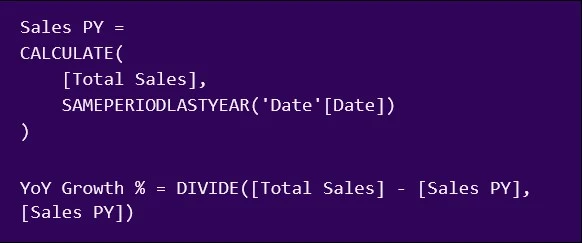
Period | Sales | YoY Growth % |
Jan–Apr 2023 | $39,000 | — |
Jan–Apr 2024 | $54,000 | +38.5% |
A proper Date table is strongly recommended for reliable time-intelligence calculations. Mark the table as a Date table and use its Date column in the time-intelligence expressions.
Recipe 3 · Running Total
Reach for this any time you want a cumulative line chart the classic "story so far" visual that climbs left to right.
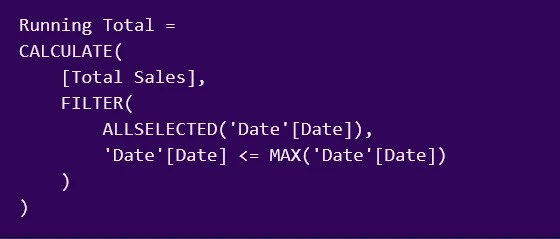
Month (2024) | Sales | Running Total |
January | $14,000 | $14,000 |
February | $16,000 | $30,000 |
March | $11,000 | $41,000 |
April | $13,000 | $54,000 |
ALLSELECTED removes the current visual-level filters from the Date column while retaining the broader filter context selected by the user. The FILTER expression then keeps dates up to the current date, producing the cumulative total.
Recipe 4 · % of Total
Reach for this whenever a number needs context "$54,000" means little on its own, but "34% of total sales" tells a story instantly.
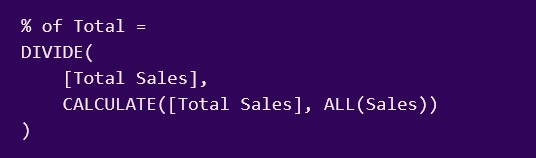
Region | Sales | % of Total |
North | ₹1,04,500 | 65.9% |
South | ₹54,000 | 34.1% |
Grand Total | ₹1,58,500 | 100.0% |
ALL(Sales) removes filters from the Sales table within this calculation, creating a broader denominator. Depending on the model and the desired definition of 'total,' you may instead need to remove filters from a specific dimension column or use ALLSELECTED.
Recipe Box Quick Reference
| Pattern | Answers | Core DAX | Needs a Date Table? |
| Variance | How far from plan? | Subtraction + DIVIDE | No |
| YoY Growth % | Are we growing? | CALCULATE + SAMEPERIODLASTYEAR | Yes |
| Running Total | What's the story so far? | CALCULATE + FILTER + ALLSELECTED | Usually |
| % of Total | How big is this slice? | DIVIDE + CALCULATE + ALL | No |
Conclusion
Building effective Power BI reports becomes much easier when you have a collection of reliable DAX patterns you can reuse. The four measure recipes covered in this guide Variance, Year-over-Year (YoY) Growth, Running Total, and % of Total are among the most commonly used calculations in business intelligence dashboards. Whether you're comparing actuals to budgets, tracking growth over time, analysing cumulative performance, or understanding each category's contribution to the whole, these measures provide a strong foundation for creating meaningful reports.