


Compare Records
Better comparison visualization
Comparing records in a Power BI report typically involves comparing data from different sources, tables, or visualizations within the report.

In today’s data-driven world, Top Power BI Consultants in Ahmedabad, India businesses rely heavily on actionable insights to stay competitive and make informed decisions. Microsoft Power BI, a leading business intelligence tool, empowers organizations to transform raw data into meaningful insights through powerful visualizations and analytics. At Desire Info web, we provide top-tier Power BI services in Canada, USA, South Africa, and Australia, enabling businesses to unlock the full potential of their data.

Better comparison visualization
Comparing records in a Power BI report typically involves comparing data from different sources, tables, or visualizations within the report.
Visualize and share insights of Projects
Project report dashboard in Power BI can provide a comprehensive overview of various project metrics, milestones, and key performance indicators (KPIs). The dashboard typically includes several key details to help stakeholders monitor the progress and performance of the project.
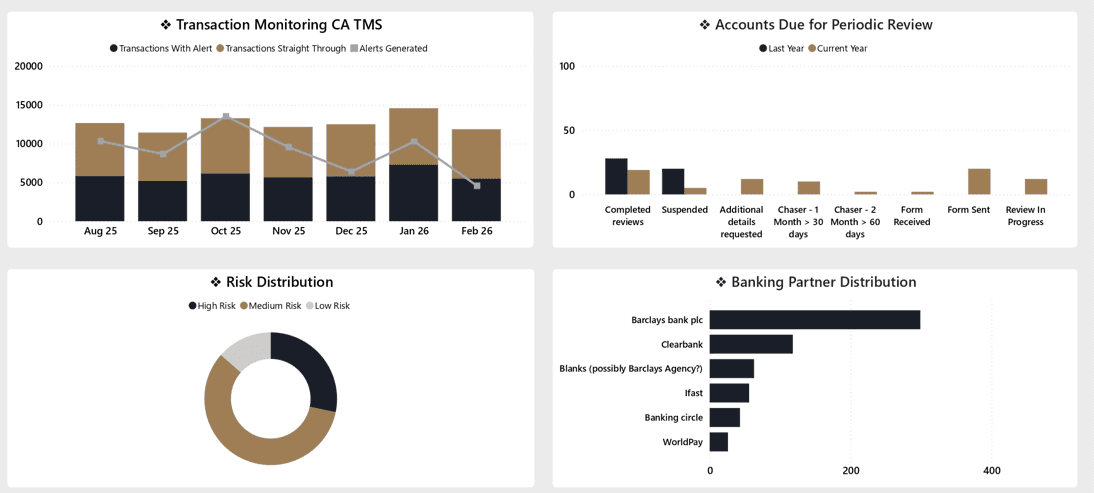
Data analysis using Custom Visuals
Analytics report dashboard in Power BI involves incorporating various key elements that help visualize and analyze data insights. The dashboard should provide a clear overview of the most important metrics and trends, enabling stakeholders to make informed decisions.
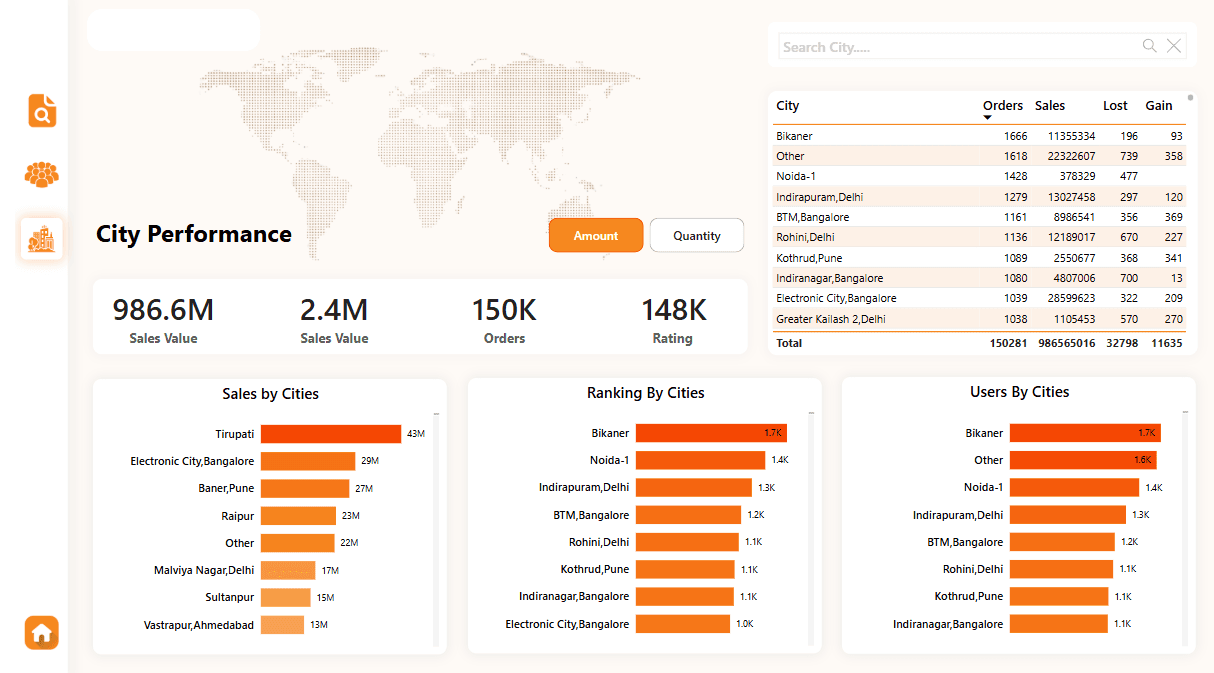
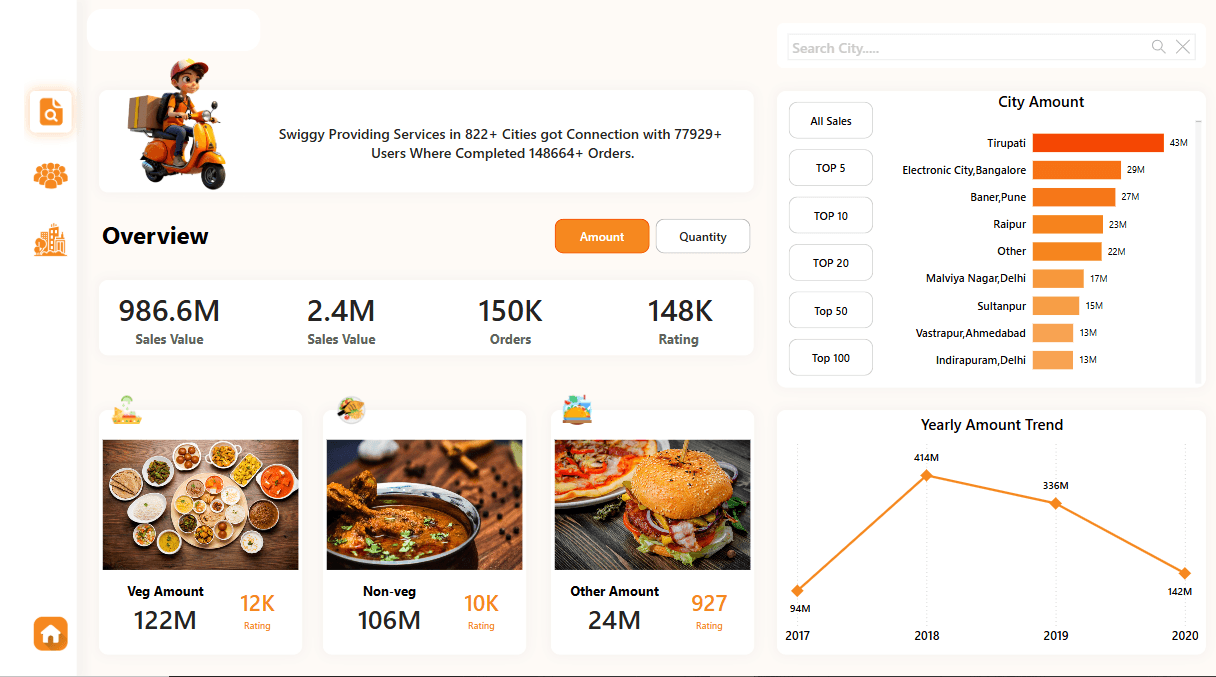
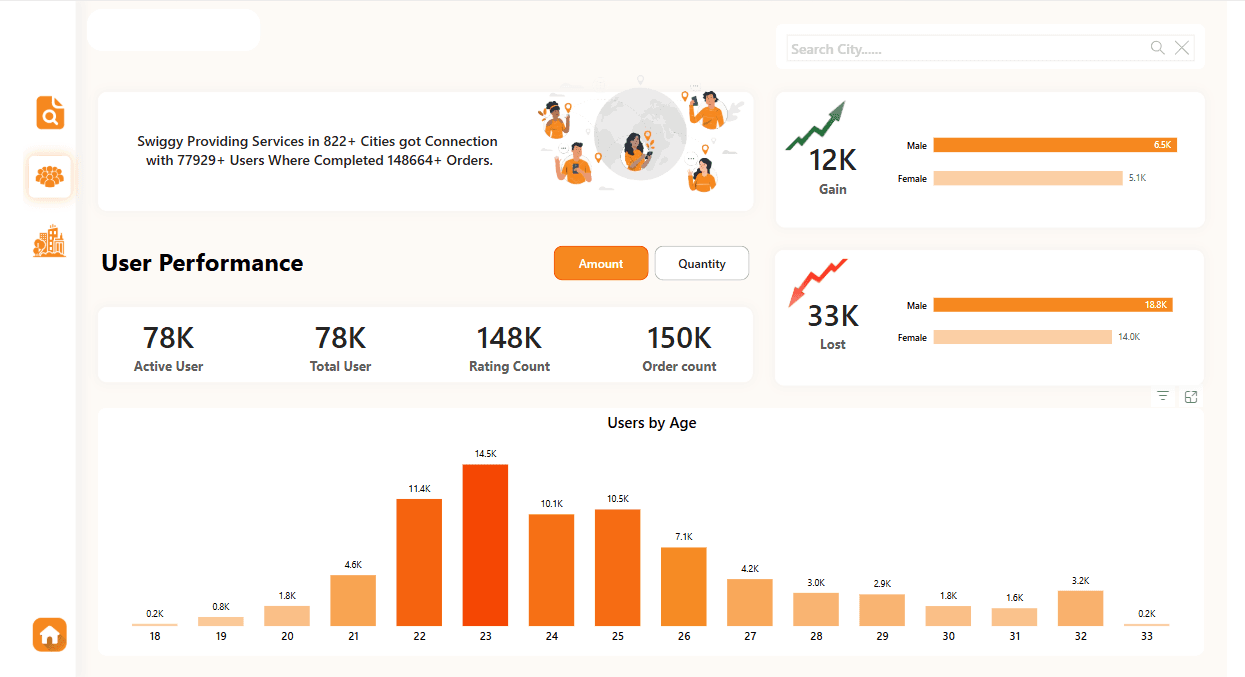
Analyze And Present Sales Data
Comprehensive sales dashboard in Power BI allows businesses to monitor and analyze their sales performance effectively. It enables stakeholders to gain valuable insights into key sales metrics and make informed decisions.